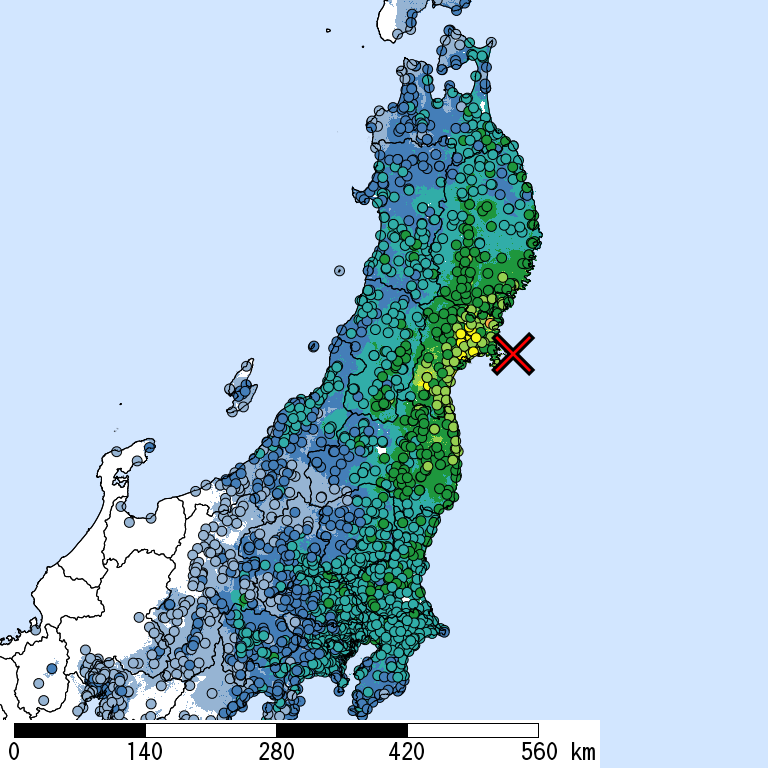
| Max. Obs. Is |
Histogram
of Estimated Is
|
Municipality
Show All Data
| Daytime Population |
Distance
[km] |
| 6- |
|
Minamisanriku,Motoyoshi,Miyagi |
17,000 |
37 |
| 5+ |
|
Miyagino,Sendai,Miyagi |
210,000 |
70 |
| 5+ |
|
Kawasaki,Shibata,Miyagi |
9,000 |
95 |
| 5+ |
|
Misato,Toda,Miyagi |
23,000 |
58 |
| 5+ |
|
Wakuya,Toda,Miyagi |
17,000 |
52 |
| 5+ |
|
Ishinomaki,Miyagi |
160,000 |
34 |
| 5+ |
|
Matsushima,Miyagi,Miyagi |
14,000 |
55 |
| 5+ |
|
Iwanuma,Miyagi |
44,000 |
79 |
| 5+ |
|
Osaki,Miyagi |
130,000 |
67 |
| 5+ |
|
Tome,Miyagi |
80,000 |
55 |
| 5+ |
|
Katsurao,Futaba,Fukushima |
1,200 |
129 |
| 5+ |
|
Higashimatsushima,Miyagi |
37,000 |
42 |
| 5+ |
|
Zao,Katta,Miyagi |
13,000 |
96 |
| 5- |
|
Rifu,Miyagi,Miyagi |
29,000 |
63 |
| 5- |
|
Namie,Futaba,Fukushima |
19,000 |
117 |
| 5- |
|
Yamamoto,Watari,Miyagi |
14,000 |
86 |
| 5- |
|
Kurihara,Miyagi |
74,000 |
69 |
| 5- |
|
Natori,Miyagi |
74,000 |
74 |
| 5- |
|
Ohira,Kurokawa,Miyagi |
9,200 |
71 |
| 5- |
|
Kunimi,Date,Fukushima |
8,600 |
116 |
| 5- |
|
Futaba,Futaba,Fukushima |
6,800 |
121 |
| 5- |
|
Kitakami,Iwate |
99,000 |
110 |
| 5- |
|
Minamisoma,Fukushima |
68,000 |
106 |
| 5- |
|
Watari,Watari,Miyagi |
29,000 |
84 |
| 5- |
|
Okuma,Futaba,Fukushima |
15,000 |
127 |
| 5- |
|
Kakuda,Miyagi |
32,000 |
93 |
| 5- |
|
Kesennuma,Miyagi |
74,000 |
57 |
| 5- |
|
Soma,Fukushima |
39,000 |
95 |
| 5- |
|
Marumori,Igu,Miyagi |
14,000 |
98 |
| 5- |
|
Osato,Kurokawa,Miyagi |
8,700 |
60 |
| 5- |
|
Sumita,Kesen,Iwate |
5,900 |
83 |
| 5- |
|
Ichinoseki,Iwate |
130,000 |
77 |
| 5- |
|
Ogawara,Shibata,Miyagi |
23,000 |
93 |
| 5- |
|
Hirata,Ishikawa,Fukushima |
6,200 |
164 |
| 5- |
|
Aoba,Sendai,Miyagi |
430,000 |
73 |
| 5- |
|
Takahata,Higashiokitama,Yamagata |
23,000 |
139 |
| 5- |
|
Izumi,Sendai,Miyagi |
170,000 |
71 |
| 5- |
|
Wakabayashi,Sendai,Miyagi |
140,000 |
71 |
| 5- |
|
Ofunato,Iwate |
43,000 |
75 |
| 5- |
|
Shibata,Shibata,Miyagi |
38,000 |
90 |
| 5- |
|
Tamura,Fukushima |
37,000 |
145 |
| 5- |
|
Shinchi,Soma,Fukushima |
7,500 |
89 |
| 5- |
|
Iitate,Soma,Fukushima |
5,500 |
116 |
| 4 |
|
Shiogama,Miyagi |
51,000 |
59 |
| 4 |
|
Fukushima,Fukushima |
300,000 |
128 |
| 4 |
|
Oshu,Iwate |
120,000 |
96 |
| 4 |
|
Date,Fukushima |
61,000 |
118 |
| 4 |
|
Hitachiota,Ibaraki |
46,000 |
231 |
| 4 |
|
Kamaishi,Iwate |
42,000 |
98 |
| 4 |
|
Yahaba,Shiwa,Iwate |
29,000 |
142 |
| 4 |
|
Murata,Shibata,Miyagi |
13,000 |
90 |
| 4 |
|
Morioka,Iwate |
320,000 |
152 |
| 4 |
|
Motomiya,Fukushima |
34,000 |
151 |
| 4 |
|
Kami,Kami,Miyagi |
25,000 |
76 |
| 4 |
|
Yamada,Shimohei,Iwate |
17,000 |
120 |
| 4 |
|
Kawamata,Date,Fukushima |
15,000 |
126 |
| 4 |
|
Shichigahama,Miyagi,Miyagi |
14,000 |
56 |
| 4 |
|
Kori,Date,Fukushima |
13,000 |
120 |
| 4 |
|
Rikuzentakata,Iwate |
21,000 |
68 |
| 4 |
|
Koriyama,Fukushima |
350,000 |
161 |
| 4 |
|
Yamagata,Yamagata |
280,000 |
119 |
| 4 |
|
Shirakawa,Fukushima |
65,000 |
192 |
| 4 |
|
Nihommatsu,Fukushima |
57,000 |
143 |
| 4 |
|
Onagawa,Oshika,Miyagi |
11,000 |
22 |
| 4 |
|
Naraha,Futaba,Fukushima |
8,100 |
138 |
| 4 |
|
Yonezawa,Yamagata |
97,000 |
148 |
| 4 |
|
Shiroishi,Miyagi |
36,000 |
104 |
| 4 |
|
Miharu,Tamura,Fukushima |
16,000 |
150 |
| 4 |
|
Hanamaki,Iwate |
98,000 |
120 |
| 4 |
|
Iwaki,Fukushima |
320,000 |
166 |
| 4 |
|
Taihaku,Sendai,Miyagi |
170,000 |
74 |
| 4 |
|
Sukagawa,Fukushima |
75,000 |
170 |
| 4 |
|
Taiwa,Kurokawa,Miyagi |
27,000 |
71 |
| 4 |
|
Tomioka,Futaba,Fukushima |
16,000 |
132 |
| 4 |
|
Hashikami,Sannohe,Aomori |
11,000 |
228 |
| 4 |
|
Nakayama,Higashimurayama,Yamagata |
9,000 |
123 |
| 4 |
|
Hiraizumi,Nishiiwai,Iwate |
7,900 |
82 |
| 4 |
|
Shikama,Kami,Miyagi |
6,700 |
75 |
| 4 |
|
Hirono,Futaba,Fukushima |
5,600 |
145 |
| 4 |
|
Kasama,Ibaraki |
70,000 |
259 |
| 4 |
|
Joso,Ibaraki |
66,000 |
304 |
| 4 |
|
Tagajo,Miyagi |
58,000 |
61 |
| 4 |
|
Omitama,Ibaraki |
51,000 |
268 |
| 4 |
|
Kanegasaki,Isawa,Iwate |
18,000 |
101 |
| 4 |
|
Tamakawa,Ishikawa,Fukushima |
7,200 |
174 |
| 4 |
|
Izumizaki,Nishishirakawa,Fukushima |
7,100 |
185 |
| 4 |
|
Tenei,Iwase,Fukushima |
5,500 |
180 |
| 4 |
|
Noda,Kunohe,Iwate |
4,200 |
190 |
| 4 |
|
Fudai,Shimohei,Iwate |
2,700 |
179 |
| 4 |
|
Inashiki,Ibaraki |
41,000 |
297 |
| 4 |
|
Daigo,Kuji,Ibaraki |
19,000 |
216 |
| 4 |
|
Miyako,Iwate |
59,000 |
139 |
| 4 |
|
Sakuragawa,Ibaraki |
43,000 |
270 |
| 4 |
|
Hachinohe,Aomori |
250,000 |
235 |
| 4 |
|
Kasukabe,Saitama |
180,000 |
320 |
| 4 |
|
Chikusei,Ibaraki |
110,000 |
277 |
| 4 |
|
Tokai,Naka,Ibaraki |
38,000 |
236 |
| 4 |
|
Tomiya,Kurokawa,Miyagi |
35,000 |
70 |
| 4 |
|
Miyashiro,Minamisaitama,Saitama |
30,000 |
317 |
| 4 |
|
Yamanobe,Higashimurayama,Yamagata |
12,000 |
125 |
| 4 |
|
Ono,Tamura,Fukushima |
11,000 |
155 |
| 4 |
|
Furudono,Ishikawa,Fukushima |
5,400 |
177 |
| 4 |
|
Nakajima,Nishishirakawa,Fukushima |
4,000 |
182 |
| 4 |
|
Motegi,Haga,Tochigi |
13,000 |
246 |
| 4 |
|
Higashine,Yamagata |
48,000 |
114 |
| 4 |
|
Yabuki,Nishishirakawa,Fukushima |
18,000 |
179 |
| 4 |
|
Nakagawa,Nasu,Tochigi |
17,000 |
228 |
| 4 |
|
Daisen,Akita |
90,000 |
157 |
| 4 |
|
Inzai,Chiba |
69,000 |
317 |
| 4 |
|
Tendo,Yamagata |
62,000 |
115 |
| 4 |
|
Naka,Ibaraki |
45,000 |
241 |
| 4 |
|
Tsukubamirai,Ibaraki |
38,000 |
308 |
| 4 |
|
Ibaraki,Higashiibaraki,Ibaraki |
31,000 |
260 |
| 4 |
|
Tono,Iwate |
29,000 |
104 |
| 4 |
|
Murayama,Yamagata |
25,000 |
115 |
| 4 |
|
Kahoku,Nishimurayama,Yamagata |
19,000 |
120 |
| 4 |
|
Kagamiishi,Iwase,Fukushima |
12,000 |
174 |
| 4 |
|
Kawauchi,Futaba,Fukushima |
2,700 |
141 |
| 4 |
|
Obanazawa,Yamagata |
19,000 |
114 |
| 4 |
|
Higashinaruse,Ogachi,Akita |
2,300 |
125 |
| 4 |
|
Nikko,Tochigi |
86,000 |
256 |
| 4 |
|
Tsuchiura,Ibaraki |
160,000 |
291 |
| 4 |
|
Kazo,Saitama |
110,000 |
313 |
| 4 |
|
Hokota,Ibaraki |
47,000 |
270 |
| 4 |
|
Takanezawa,Shioya,Tochigi |
25,000 |
248 |
| 4 |
|
Aizumisato,Onuma,Fukushima |
19,000 |
193 |
| 4 |
|
Ishikawa,Ishikawa,Fukushima |
18,000 |
177 |
| 4 |
|
Kawanishi,Higashiokitama,Yamagata |
16,000 |
151 |
| 4 |
|
Tanagura,Higashishirakawa,Fukushima |
15,000 |
191 |
| 4 |
|
Inawashiro,Yama,Fukushima |
15,000 |
168 |
| 4 |
|
Shirataka,Nishiokitama,Yamagata |
14,000 |
141 |
| 4 |
|
Ichikai,Haga,Tochigi |
9,900 |
250 |
| 4 |
|
Otama,Adachi,Fukushima |
7,200 |
151 |
| 4 |
|
Asakawa,Ishikawa,Fukushima |
5,800 |
185 |
| 4 |
|
Minamimaki,Minamisaku,Nagano |
3,900 |
388 |
| 4 |
|
Hitachi,Ibaraki |
210,000 |
220 |
| 4 |
|
Hachimantai,Iwate |
28,000 |
177 |
| 4 |
|
Shingo,Sannohe,Aomori |
2,600 |
234 |
| 4 |
|
Takahagi,Ibaraki |
29,000 |
206 |
| 4 |
|
Haga,Haga,Tochigi |
33,000 |
251 |
| 4 |
|
Aga,Higashikambara,Niigata |
13,000 |
212 |
| 4 |
|
Nishikawa,Nishimurayama,Yamagata |
5,700 |
135 |
| 4 |
|
Katori,Chiba |
77,000 |
297 |
| 4 |
|
Ishioka,Ibaraki |
73,000 |
275 |
| 4 |
|
Shimotsuma,Ibaraki |
45,000 |
290 |
| 4 |
|
Kitaibaraki,Ibaraki |
43,000 |
196 |
| 4 |
|
Kuji,Iwate |
38,000 |
199 |
| 4 |
|
Ora,Ora,Gumma |
26,000 |
310 |
| 4 |
|
Oirase,Kamikita,Aomori |
21,000 |
245 |
| 4 |
|
Kawajima,Hiki,Saitama |
21,000 |
333 |
| 4 |
|
Aizubange,Kawanuma,Fukushima |
17,000 |
189 |
| 4 |
|
Oshino,Minamitsuru,Yamanashi |
9,200 |
413 |
| 4 |
|
Hitachiomiya,Ibaraki |
43,000 |
235 |
| 4 |
|
Nishigo,Nishishirakawa,Fukushima |
20,000 |
194 |
| 4 |
|
Kunohe,Kunohe,Iwate |
6,100 |
202 |
| 4 |
|
Ninohe,Iwate |
30,000 |
210 |
| 4 |
|
Bando,Ibaraki |
52,000 |
306 |
| 4 |
|
Hitachinaka,Ibaraki |
150,000 |
245 |
| 4 |
|
Tsukuba,Ibaraki |
220,000 |
299 |
| 4 |
|
Kuki,Saitama |
130,000 |
316 |
| 4 |
|
Mito,Ibaraki |
310,000 |
250 |
| 4 |
|
Aizuwakamatsu,Fukushima |
130,000 |
184 |
| 4 |
|
Naka,Yokohama,Kanagawa |
260,000 |
376 |
| 4 |
|
Urayasu,Chiba |
160,000 |
344 |
| 4 |
|
Mihama,Chiba,Chiba |
160,000 |
339 |
| 4 |
|
Yokote,Akita |
100,000 |
141 |
| 4 |
|
Toride,Ibaraki |
93,000 |
312 |
| 4 |
|
Chuo,Saitama,Saitama |
84,000 |
334 |
| 4 |
|
Yurihonjo,Akita |
82,000 |
180 |
| 4 |
|
Yashio,Saitama |
82,000 |
330 |
| 4 |
|
Nanyo,Yamagata |
33,000 |
140 |
| 4 |
|
Nasu,Nasu,Tochigi |
29,000 |
206 |
| 4 |
|
Shiwa,Shiwa,Iwate |
28,000 |
136 |
| 4 |
|
Gonohe,Sannohe,Aomori |
17,000 |
239 |
| 4 |
|
Nambu,Sannohe,Aomori |
17,000 |
231 |
| 4 |
|
Shichinohe,Kamikita,Aomori |
17,000 |
264 |
| 4 |
|
Shirosato,Higashiibaraki,Ibaraki |
16,000 |
243 |
| 4 |
|
Otsuchi,Kamihei,Iwate |
14,000 |
108 |
| 4 |
|
Meiwa,Ora,Gumma |
12,000 |
309 |
| 4 |
|
Funagata,Mogami,Yamagata |
5,200 |
124 |
| 3 |
|
Asahi,Yokohama,Kanagawa |
180,000 |
377 |
| 3 |
|
Hirono,Kunohe,Iwate |
16,000 |
223 |
| 3 |
|
Narita,Chiba |
160,000 |
316 |
| 3 |
|
Sakura,Chiba |
130,000 |
325 |
| 3 |
|
Utsunomiya,Tochigi |
510,000 |
260 |
| 3 |
|
Matsudo,Chiba |
340,000 |
331 |
| 3 |
|
Fuji,Shizuoka |
250,000 |
449 |
| 3 |
|
Noda,Chiba |
140,000 |
316 |
| 3 |
|
Konosu,Saitama |
92,000 |
323 |
| 3 |
|
Ryugasaki,Ibaraki |
73,000 |
307 |
| 3 |
|
Murakami,Niigata |
65,000 |
194 |
| 3 |
|
Kitakata,Fukushima |
51,000 |
180 |
| 3 |
|
Takizawa,Iwate |
48,000 |
157 |
| 3 |
|
Shinjo,Yamagata |
43,000 |
128 |
| 3 |
|
Tohoku,Kamikita,Aomori |
18,000 |
261 |
| 3 |
|
Rokunohe,Kamikita,Aomori |
9,400 |
247 |
| 3 |
|
Mogami,Mogami,Yamagata |
9,100 |
110 |
| 3 |
|
Asahi,Nishimurayama,Yamagata |
6,900 |
135 |
| 3 |
|
Yamatsuri,Higashishirakawa,Fukushima |
6,500 |
203 |
| 3 |
|
Ikawa,Minamiakita,Akita |
5,100 |
218 |
| 3 |
|
Okura,Mogami,Yamagata |
3,200 |
132 |
| 3 |
|
Shichikashuku,Katta,Miyagi |
1,700 |
118 |
| 3 |
|
Atsugi,Kanagawa |
260,000 |
388 |
| 3 |
|
Omiya,Saitama,Saitama |
170,000 |
332 |
| 3 |
|
Kaminoyama,Yamagata |
32,000 |
128 |
| 3 |
|
Odawara,Kanagawa |
190,000 |
415 |
| 3 |
|
Shiroi,Chiba |
47,000 |
324 |
| 3 |
|
Kanuma,Tochigi |
99,000 |
266 |
| 3 |
|
Adachi,Tokyo |
510,000 |
336 |
| 3 |
|
Edogawa,Tokyo |
470,000 |
340 |
| 3 |
|
Itabashi,Tokyo |
420,000 |
343 |
| 3 |
|
Kohoku,Yokohama,Kanagawa |
290,000 |
369 |
| 3 |
|
Kanagawa,Yokohama,Kanagawa |
240,000 |
373 |
| 3 |
|
Nishi,Yokohama,Kanagawa |
210,000 |
376 |
| 3 |
|
Kumagaya,Saitama |
200,000 |
323 |
| 3 |
|
Tochigi,Tochigi |
160,000 |
283 |
| 3 |
|
Midori,Yokohama,Kanagawa |
130,000 |
374 |
| 3 |
|
Kamisu,Ibaraki |
98,000 |
293 |
| 3 |
|
Midori,Saitama,Saitama |
86,000 |
333 |
| 3 |
|
Ami,Inashiki,Ibaraki |
47,000 |
294 |
| 3 |
|
Kasumigaura,Ibaraki |
35,000 |
281 |
| 3 |
|
Namegata,Ibaraki |
34,000 |
288 |
| 3 |
|
Itako,Ibaraki |
26,000 |
290 |
| 3 |
|
Yoshimi,Hiki,Saitama |
19,000 |
329 |
| 3 |
|
Ichinohe,Ninohe,Iwate |
15,000 |
204 |
| 3 |
|
Iwate,Iwate,Iwate |
14,000 |
179 |
| 3 |
|
Goka,Sashima,Ibaraki |
11,000 |
307 |
| 3 |
|
Oguni,Nishiokitama,Yamagata |
8,900 |
175 |
| 3 |
|
Kawachi,Inashiki,Ibaraki |
8,200 |
307 |
| 3 |
|
Oishida,Kitamurayama,Yamagata |
7,200 |
117 |
| 3 |
|
Tozawa,Mogami,Yamagata |
4,700 |
140 |
| 3 |
|
Hachioji,Tokyo |
560,000 |
370 |
| 3 |
|
Kyonan,Awa,Chiba |
7,400 |
401 |
| 3 |
|
Semboku,Akita |
30,000 |
167 |
| 3 |
|
Koto,Tokyo |
530,000 |
346 |
| 3 |
|
Sagae,Yamagata |
43,000 |
124 |
| 3 |
|
Funabashi,Chiba |
470,000 |
337 |
| 3 |
|
Kawaguchi,Saitama |
440,000 |
337 |
| 3 |
|
Suginami,Tokyo |
380,000 |
351 |
| 3 |
|
Akita,Akita |
330,000 |
201 |
| 3 |
|
Chuo,Chiba,Chiba |
260,000 |
340 |
| 3 |
|
Totsuka,Yokohama,Kanagawa |
220,000 |
385 |
| 3 |
|
Arakawa,Tokyo |
160,000 |
341 |
| 3 |
|
Hodogaya,Yokohama,Kanagawa |
150,000 |
376 |
| 3 |
|
Tsuruoka,Yamagata |
140,000 |
166 |
| 3 |
|
Koga,Ibaraki |
130,000 |
301 |
| 3 |
|
Minuma,Saitama,Saitama |
120,000 |
328 |
| 3 |
|
Sakata,Yamagata |
110,000 |
171 |
| 3 |
|
Tatebayashi,Gumma |
77,000 |
306 |
| 3 |
|
Gyoda,Saitama |
77,000 |
320 |
| 3 |
|
Fujimi,Saitama |
70,000 |
341 |
| 3 |
|
Kashima,Ibaraki |
69,000 |
286 |
| 3 |
|
Kita,Niigata,Niigata |
68,000 |
223 |
| 3 |
|
Minamiuonuma,Niigata |
63,000 |
289 |
| 3 |
|
Tsurugashima,Saitama |
54,000 |
341 |
| 3 |
|
Yuzawa,Akita |
53,000 |
134 |
| 3 |
|
Hanyu,Saitama |
52,000 |
312 |
| 3 |
|
Shimotsuke,Tochigi |
52,000 |
277 |
| 3 |
|
Yoshikawa,Saitama |
49,000 |
323 |
| 3 |
|
Oizumi,Ora,Gumma |
46,000 |
313 |
| 3 |
|
Satte,Saitama |
45,000 |
311 |
| 3 |
|
Tomisato,Chiba |
40,000 |
320 |
| 3 |
|
Shiraoka,Saitama |
37,000 |
319 |
| 3 |
|
Ninomiya,Naka,Kanagawa |
21,000 |
407 |
| 3 |
|
Shonai,Higashitagawa,Yamagata |
20,000 |
163 |
| 3 |
|
Miho,Inashiki,Ibaraki |
16,000 |
293 |
| 3 |
|
Yuza,Akumi,Yamagata |
13,000 |
169 |
| 3 |
|
Chiyoda,Ora,Gumma |
12,000 |
314 |
| 3 |
|
Karumai,Kunohe,Iwate |
9,700 |
215 |
| 3 |
|
Mikawa,Higashitagawa,Yamagata |
9,200 |
166 |
| 3 |
|
Oe,Nishimurayama,Yamagata |
8,100 |
130 |
| 3 |
|
Iide,Nishiokitama,Yamagata |
7,200 |
154 |
| 3 |
|
Yugawa,Kawanuma,Fukushima |
2,700 |
184 |
| 3 |
|
Hanno,Saitama |
76,000 |
352 |
| 3 |
|
Oyama,Tochigi |
160,000 |
286 |
| 3 |
|
Towada,Aomori |
67,000 |
249 |
| 3 |
|
Sakura,Tochigi |
41,000 |
244 |
| 3 |
|
Shizukuishi,Iwate,Iwate |
17,000 |
157 |
| 3 |
|
Kisarazu,Chiba |
120,000 |
371 |
| 3 |
|
Misawa,Aomori |
42,000 |
255 |
| 3 |
|
Noheji,Kamikita,Aomori |
14,000 |
278 |
| 3 |
|
Iwatsuki,Saitama,Saitama |
110,000 |
324 |
| 3 |
|
Chiyoda,Tokyo |
1,200,000 |
346 |
| 3 |
|
Fujisawa,Kanagawa |
360,000 |
392 |
| 3 |
|
Sumida,Tokyo |
270,000 |
343 |
| 3 |
|
Kofu,Yamanashi |
230,000 |
412 |
| 3 |
|
Isesaki,Gumma |
200,000 |
320 |
| 3 |
|
Ashikaga,Tochigi |
160,000 |
303 |
| 3 |
|
Yachiyo,Chiba |
150,000 |
329 |
| 3 |
|
Miyamae,Kawasaki,Kanagawa |
130,000 |
364 |
| 3 |
|
Misato,Saitama |
110,000 |
328 |
| 3 |
|
Moka,Tochigi |
84,000 |
263 |
| 3 |
|
Yotsukaido,Chiba |
69,000 |
332 |
| 3 |
|
Samukawa,Koza,Kanagawa |
44,000 |
394 |
| 3 |
|
Sugito,Kitakatsushika,Saitama |
39,000 |
316 |
| 3 |
|
Yaita,Tochigi |
35,000 |
236 |
| 3 |
|
Moroyama,Iruma,Saitama |
35,000 |
345 |
| 3 |
|
Chuo,Yamanashi |
33,000 |
420 |
| 3 |
|
Tainai,Niigata |
31,000 |
203 |
| 3 |
|
Nasukarasuyama,Tochigi |
27,000 |
237 |
| 3 |
|
Sakai,Sashima,Ibaraki |
26,000 |
305 |
| 3 |
|
Misato,Semboku,Akita |
20,000 |
152 |
| 3 |
|
Mashiko,Haga,Tochigi |
20,000 |
257 |
| 3 |
|
Shisui,Imba,Chiba |
17,000 |
323 |
| 3 |
|
Sakae,Imba,Chiba |
15,000 |
312 |
| 3 |
|
Hanawa,Higashishirakawa,Fukushima |
9,300 |
196 |
| 3 |
|
Matsuzaki,Kamo,Shizuoka |
7,600 |
482 |
| 3 |
|
Nishiwaga,Waga,Iwate |
6,900 |
129 |
| 3 |
|
Yanaizu,Kawanuma,Fukushima |
3,700 |
198 |
| 3 |
|
Sammu,Chiba |
47,000 |
331 |
| 3 |
|
Ota,Gumma |
230,000 |
311 |
| 3 |
|
Otawara,Tochigi |
80,000 |
225 |
| 3 |
|
Togane,Chiba |
61,000 |
337 |
| 3 |
|
Nagai,Yamagata |
30,000 |
148 |
| 3 |
|
Ichikawamisato,Nishiyatsushiro,Yamanashi |
16,000 |
424 |
| 3 |
|
Takasaki,Gumma |
380,000 |
331 |
| 3 |
|
Shimizu,Shizuoka,Shizuoka |
240,000 |
472 |
| 3 |
|
Hiratsuka,Kanagawa |
270,000 |
399 |
| 3 |
|
Setagaya,Tokyo |
650,000 |
356 |
| 3 |
|
Ota,Tokyo |
630,000 |
361 |
| 3 |
|
Shibuya,Tokyo |
590,000 |
352 |
| 3 |
|
Maebashi,Gumma |
360,000 |
322 |
| 3 |
|
Ichikawa,Chiba |
330,000 |
336 |
| 3 |
|
Kashiwa,Chiba |
330,000 |
320 |
| 3 |
|
Koshigaya,Saitama |
260,000 |
326 |
| 3 |
|
Kawasaki,Kawasaki,Kanagawa |
240,000 |
365 |
| 3 |
|
Soka,Saitama |
190,000 |
331 |
| 3 |
|
Ageo,Saitama |
180,000 |
327 |
| 3 |
|
Hino,Tokyo |
150,000 |
365 |
| 3 |
|
Midori,Sagamihara,Kanagawa |
140,000 |
375 |
| 3 |
|
Hanamigawa,Chiba,Chiba |
120,000 |
337 |
| 3 |
|
Minami,Saitama,Saitama |
120,000 |
337 |
| 3 |
|
Nagareyama,Chiba |
120,000 |
324 |
| 3 |
|
Ebina,Kanagawa |
120,000 |
387 |
| 3 |
|
Sakado,Saitama |
92,000 |
339 |
| 3 |
|
Gotemba,Shizuoka |
87,000 |
422 |
| 3 |
|
Asahi,Chiba |
65,000 |
312 |
| 3 |
|
Moriya,Ibaraki |
49,000 |
312 |
| 3 |
|
Yuki,Ibaraki |
49,000 |
283 |
| 3 |
|
Nikaho,Akita |
28,000 |
179 |
| 3 |
|
Matsubushi,Kitakatsushika,Saitama |
24,000 |
321 |
| 3 |
|
Mitane,Yamamoto,Akita |
17,000 |
238 |
| 3 |
|
Ugo,Ogachi,Akita |
15,000 |
142 |
| 3 |
|
Itakura,Ora,Gumma |
15,000 |
304 |
| 3 |
|
Nakai,Ashigarakami,Kanagawa |
14,000 |
406 |
| 3 |
|
Fujikawa,Minamikoma,Yamanashi |
13,000 |
427 |
| 3 |
|
Sannohe,Sannohe,Aomori |
11,000 |
223 |
| 3 |
|
Shirako,Chosei,Chiba |
10,000 |
348 |
| 3 |
|
Kuzumaki,Iwate,Iwate |
6,900 |
183 |
| 3 |
|
Kozaki,Katori,Chiba |
5,200 |
300 |
| 3 |
|
Samegawa,Higashishirakawa,Fukushima |
3,600 |
183 |
| 3 |
|
Iwaizumi,Shimohei,Iwate |
11,000 |
160 |
| 3 |
|
Otsuki,Yamanashi |
26,000 |
395 |
| 3 |
|
Machida,Tokyo |
370,000 |
374 |
| 3 |
|
Ome,Tokyo |
120,000 |
361 |
| 3 |
|
Sosa,Chiba |
37,000 |
315 |
| 3 |
|
Nishiaizu,Yama,Fukushima |
7,100 |
201 |
| 3 |
|
Honjo,Saitama |
80,000 |
326 |
| 3 |
|
Isumi,Chiba |
37,000 |
368 |
| 3 |
|
Chuo,Tokyo |
840,000 |
348 |
| 3 |
|
Katsushika,Tokyo |
320,000 |
338 |
| 3 |
|
Tsurumi,Yokohama,Kanagawa |
230,000 |
368 |
| 3 |
|
Aoba,Yokohama,Kanagawa |
210,000 |
370 |
| 3 |
|
Chigasaki,Kanagawa |
170,000 |
397 |
| 3 |
|
Narashino,Chiba |
150,000 |
336 |
| 3 |
|
Toda,Saitama |
110,000 |
338 |
| 3 |
|
Nasushiobara,Tochigi |
110,000 |
216 |
| 3 |
|
Shibukawa,Gumma |
81,000 |
319 |
| 3 |
|
Kamagaya,Chiba |
78,000 |
328 |
| 3 |
|
Ayase,Kanagawa |
77,000 |
386 |
| 3 |
|
Ushiku,Ibaraki |
68,000 |
302 |
| 3 |
|
Minamiarupusu,Yamanashi |
65,000 |
422 |
| 3 |
|
Okegawa,Saitama |
63,000 |
327 |
| 3 |
|
Inagi,Tokyo |
59,000 |
363 |
| 3 |
|
Kai,Yamanashi |
56,000 |
415 |
| 3 |
|
Tateyama,Chiba |
51,000 |
412 |
| 3 |
|
Fujiyoshida,Yamanashi |
50,000 |
413 |
| 3 |
|
Hokuto,Yamanashi |
48,000 |
411 |
| 3 |
|
Yugawara,Ashigarashimo,Kanagawa |
23,000 |
428 |
| 3 |
|
Nogi,Shimotsuga,Tochigi |
22,000 |
296 |
| 3 |
|
Yachiyo,Yuki,Ibaraki |
20,000 |
294 |
| 3 |
|
Minamiaizu,Minamiaizu,Fukushima |
18,000 |
215 |
| 3 |
|
Oi,Ashigarakami,Kanagawa |
17,000 |
409 |
| 3 |
|
Tako,Katori,Chiba |
16,000 |
315 |
| 3 |
|
Tonosho,Katori,Chiba |
12,000 |
299 |
| 3 |
|
Tone,Kitasoma,Ibaraki |
12,000 |
314 |
| 3 |
|
Mamurogawa,Mogami,Yamagata |
8,200 |
135 |
| 3 |
|
Takko,Sannohe,Aomori |
6,300 |
220 |
| 3 |
|
Yamanakako,Minamitsuru,Yamanashi |
6,200 |
417 |
| 3 |
|
Kiryu,Gumma |
120,000 |
304 |
| 3 |
|
Midori,Chiba,Chiba |
83,000 |
343 |
| 3 |
|
Minato,Tokyo |
1,100,000 |
350 |
| 3 |
|
Shinagawa,Tokyo |
510,000 |
356 |
| 3 |
|
Bunkyo,Tokyo |
400,000 |
345 |
| 3 |
|
Taito,Tokyo |
330,000 |
343 |
| 3 |
|
Nakano,Tokyo |
250,000 |
349 |
| 3 |
|
Chuo,Sagamihara,Kanagawa |
220,000 |
376 |
| 3 |
|
Nakahara,Kawasaki,Kanagawa |
180,000 |
362 |
| 3 |
|
Chofu,Tokyo |
180,000 |
360 |
| 3 |
|
Tama,Tokyo |
140,000 |
366 |
| 3 |
|
Urawa,Saitama,Saitama |
140,000 |
335 |
| 3 |
|
Fukaya,Saitama |
140,000 |
325 |
| 3 |
|
Inage,Chiba,Chiba |
130,000 |
338 |
| 3 |
|
Saiwai,Kawasaki,Kanagawa |
130,000 |
364 |
| 3 |
|
Kita,Saitama,Saitama |
120,000 |
330 |
| 3 |
|
Higashi,Niigata,Niigata |
120,000 |
235 |
| 3 |
|
Sano,Tochigi |
120,000 |
298 |
| 3 |
|
Wakaba,Chiba,Chiba |
120,000 |
336 |
| 3 |
|
Shibata,Niigata |
99,000 |
213 |
| 3 |
|
Seya,Yokohama,Kanagawa |
95,000 |
380 |
| 3 |
|
Higashimatsuyama,Saitama |
83,000 |
331 |
| 3 |
|
Sakura,Saitama,Saitama |
78,000 |
338 |
| 3 |
|
Nishi,Saitama,Saitama |
73,000 |
333 |
| 3 |
|
Fuefuki,Yamanashi |
63,000 |
409 |
| 3 |
|
Noshiro,Akita |
63,000 |
247 |
| 3 |
|
Mutsu,Aomori |
60,000 |
324 |
| 3 |
|
Yachimata,Chiba |
59,000 |
327 |
| 3 |
|
Warabi,Saitama |
57,000 |
337 |
| 3 |
|
Minami,Niigata,Niigata |
43,000 |
244 |
| 3 |
|
Agano,Niigata |
41,000 |
225 |
| 3 |
|
Minamiboso,Chiba |
39,000 |
408 |
| 3 |
|
Kamogawa,Chiba |
37,000 |
392 |
| 3 |
|
Mitsuke,Niigata |
37,000 |
262 |
| 3 |
|
Mibu,Shimotsuga,Tochigi |
37,000 |
275 |
| 3 |
|
Tamamura,Sawa,Gumma |
31,000 |
326 |
| 3 |
|
Kamo,Niigata |
28,000 |
246 |
| 3 |
|
Fujikawaguchiko,Minamitsuru,Yamanashi |
26,000 |
415 |
| 3 |
|
Kujukuri,Sambu,Chiba |
15,000 |
337 |
| 3 |
|
Chosei,Chosei,Chiba |
12,000 |
353 |
| 3 |
|
Misato,Kodama,Saitama |
11,000 |
332 |
| 3 |
|
Matsuda,Ashigarakami,Kanagawa |
11,000 |
408 |
| 3 |
|
Gojome,Minamiakita,Akita |
10,000 |
219 |
| 3 |
|
Higashidori,Shimokita,Aomori |
6,500 |
321 |
| 3 |
|
Kariwa,Kariwa,Niigata |
5,200 |
291 |
| 3 |
|
Sakegawa,Mogami,Yamagata |
4,200 |
135 |
| 3 |
|
Sekikawa,Iwafune,Niigata |
5,700 |
189 |
| 3 |
|
Kazuno,Akita |
34,000 |
216 |
| 3 |
|
Ichihara,Chiba |
240,000 |
352 |
| 3 |
|
Kanna,Tano,Gumma |
2,800 |
353 |
| 3 |
|
Aomori,Aomori |
310,000 |
281 |
| 3 |
|
Shimogo,Minamiaizu,Fukushima |
6,100 |
204 |
| 3 |
|
Nerima,Tokyo |
460,000 |
347 |
| 3 |
|
Kita,Tokyo |
300,000 |
342 |
| 3 |
|
Minami,Sagamihara,Kanagawa |
210,000 |
377 |
| 3 |
|
Konan,Yokohama,Kanagawa |
160,000 |
382 |
| 3 |
|
Izumi,Yokohama,Kanagawa |
110,000 |
385 |
| 3 |
|
Abiko,Chiba |
100,000 |
318 |
| 3 |
|
Saku,Nagano |
99,000 |
372 |
| 3 |
|
Zama,Kanagawa |
90,000 |
382 |
| 3 |
|
Choshi,Chiba |
72,000 |
306 |
| 3 |
|
Kunitachi,Tokyo |
70,000 |
362 |
| 3 |
|
Wako,Saitama |
61,000 |
345 |
| 3 |
|
Annaka,Gumma |
58,000 |
339 |
| 3 |
|
Hasuda,Saitama |
51,000 |
322 |
| 3 |
|
Kitamoto,Saitama |
51,000 |
326 |
| 3 |
|
Numata,Gumma |
51,000 |
304 |
| 3 |
|
Komae,Tokyo |
50,000 |
360 |
| 3 |
|
Gosen,Niigata |
49,000 |
232 |
| 3 |
|
Hidaka,Saitama |
48,000 |
347 |
| 3 |
|
Ina,Kitaadachi,Saitama |
41,000 |
324 |
| 3 |
|
Kamisato,Kodama,Saitama |
28,000 |
328 |
| 3 |
|
Yokoshibahikari,Sambu,Chiba |
21,000 |
322 |
| 3 |
|
Hiranai,Higashitsugaru,Aomori |
11,000 |
288 |
| 3 |
|
Tokigawa,Hiki,Saitama |
11,000 |
340 |
| 3 |
|
Yamakita,Ashigarakami,Kanagawa |
11,000 |
410 |
| 3 |
|
Sotogahama,Higashitsugaru,Aomori |
6,400 |
307 |
| 3 |
|
Mutsuzawa,Chosei,Chiba |
6,100 |
359 |
| 3 |
|
Hachirogata,Minamiakita,Akita |
5,600 |
222 |
| 3 |
|
Tanohata,Shimohei,Iwate |
3,600 |
170 |
| 3 |
|
Kimitsu,Chiba |
84,000 |
376 |
| 3 |
|
Sanjo,Niigata |
110,000 |
254 |
| 3 |
|
Kawagoe,Saitama |
310,000 |
337 |
| 3 |
|
Akiha,Niigata,Niigata |
63,000 |
236 |
| 3 |
|
Suwa,Nagano |
59,000 |
411 |
| 3 |
|
Hakodate,Hokkaido |
280,000 |
383 |
| 3 |
|
Izu,Shizuoka |
33,000 |
452 |
| 3 |
|
Shinjuku,Tokyo |
850,000 |
349 |
| 3 |
|
Meguro,Tokyo |
240,000 |
354 |
| 3 |
|
Tsuzuki,Yokohama,Kanagawa |
180,000 |
369 |
| 3 |
|
Musashino,Tokyo |
170,000 |
353 |
| 3 |
|
Kodaira,Tokyo |
150,000 |
356 |
| 3 |
|
Mitaka,Tokyo |
140,000 |
356 |
| 3 |
|
Isehara,Kanagawa |
100,000 |
394 |
| 3 |
|
Kokubunji,Tokyo |
95,000 |
358 |
| 3 |
|
Sakae,Yokohama,Kanagawa |
89,000 |
387 |
| 3 |
|
Midori,Gumma |
48,000 |
308 |
| 3 |
|
Izunokuni,Shizuoka |
47,000 |
448 |
| 3 |
|
Futtsu,Chiba |
44,000 |
381 |
| 3 |
|
Minamiashigara,Kanagawa |
40,000 |
413 |
| 3 |
|
Kaminokawa,Kawachi,Tochigi |
33,000 |
269 |
| 3 |
|
Oamishirasato,Chiba |
33,000 |
342 |
| 3 |
|
Hirakawa,Aomori |
32,000 |
261 |
| 3 |
|
Koshu,Yamanashi |
31,000 |
399 |
| 3 |
|
Fujisaki,Minamitsugaru,Aomori |
14,000 |
271 |
| 3 |
|
Shibayama,Sambu,Chiba |
12,000 |
321 |
| 3 |
|
Tagami,Minamikambara,Niigata |
11,000 |
244 |
| 3 |
|
Yokohama,Kamikita,Aomori |
4,800 |
300 |
| 3 |
|
Bandai,Yama,Fukushima |
4,200 |
176 |
| 3 |
|
Koganei,Tokyo |
100,000 |
358 |
| 3 |
|
Odate,Akita |
82,000 |
229 |
| 3 |
|
Kitaakita,Akita |
36,000 |
233 |
| 3 |
|
Toshima-ku,Tokyo |
420,000 |
344 |
| 3 |
|
Yokosuka,Kanagawa |
360,000 |
390 |
| 3 |
|
Nagaoka,Niigata |
290,000 |
272 |
| 3 |
|
Fuchu,Tokyo |
240,000 |
362 |
| 3 |
|
Kanazawa,Yokohama,Kanagawa |
190,000 |
387 |
| 3 |
|
Yamato,Kanagawa |
180,000 |
380 |
| 3 |
|
Tama,Kawasaki,Kanagawa |
150,000 |
362 |
| 3 |
|
Nishi,Niigata,Niigata |
140,000 |
245 |
| 3 |
|
Sayama,Saitama |
140,000 |
348 |
| 3 |
|
Asao,Kawasaki,Kanagawa |
120,000 |
366 |
| 3 |
|
Isogo,Yokohama,Kanagawa |
120,000 |
381 |
| 3 |
|
Iruma,Saitama |
120,000 |
350 |
| 3 |
|
Higashimurayama,Tokyo |
110,000 |
354 |
| 3 |
|
Tsubame,Niigata |
84,000 |
259 |
| 3 |
|
Fujimino,Saitama |
82,000 |
340 |
| 3 |
|
Chichibu,Saitama |
66,000 |
354 |
| 3 |
|
Konan,Niigata,Niigata |
66,000 |
235 |
| 3 |
|
Higashiyamato,Tokyo |
63,000 |
357 |
| 3 |
|
Tsugaru,Aomori |
36,000 |
290 |
| 3 |
|
Katagami,Akita |
29,000 |
221 |
| 3 |
|
Oyama,Sunto,Shizuoka |
21,000 |
415 |
| 3 |
|
Oarai,Higashiibaraki,Ibaraki |
18,000 |
252 |
| 3 |
|
Hatoyama,Hiki,Saitama |
16,000 |
340 |
| 3 |
|
Ichinomiya,Chosei,Chiba |
11,000 |
356 |
| 3 |
|
Nishiizu,Kamo,Shizuoka |
9,700 |
480 |
| 3 |
|
Chonan,Chosei,Chiba |
8,900 |
359 |
| 3 |
|
Kaneyama,Mogami,Yamagata |
5,500 |
129 |