
Updated: 2025-12-29 07:46:20 (UTC+9)
Ver.8
Final Report
![]()
2025-12-29 07:35 (UTC+9),
ASO, KUMAMOTO,
10km Depth, M 4.0 by JMA
ASO, KUMAMOTO,
10km Depth, M 4.0 by JMA
Is Distribution
Maximum Observed Is:4
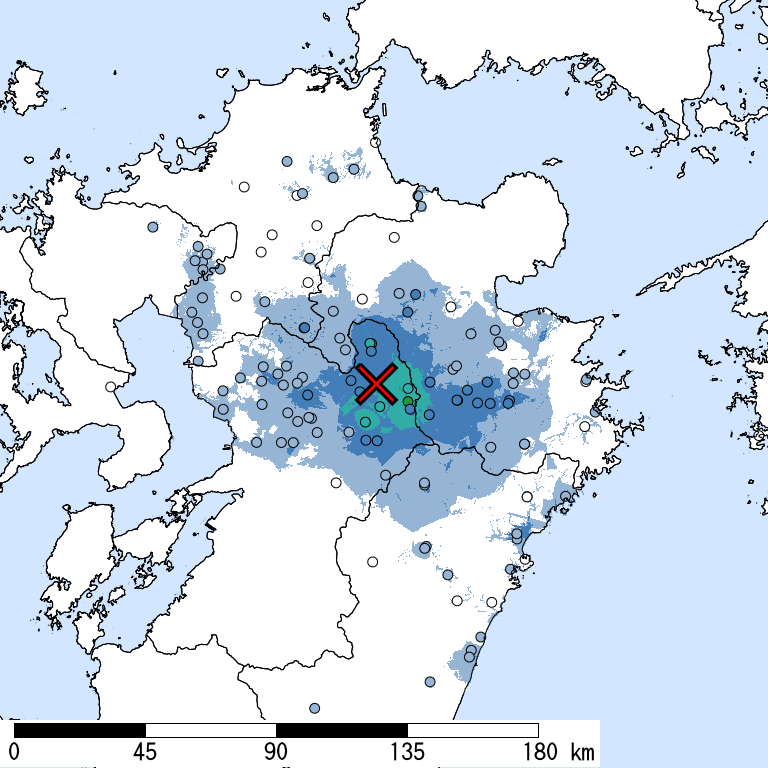
Seismic Intensity (Is) distribution is estimated from the observed data (circles) of NIED K-NET, KiK-net, JMA, and local governments that had been collected by 2025/12/29 07:45:32.
Estimated Is for Major Cities
| Max. Obs. Is | Histogram of Estimated Is |
Municipality
Show All Data | Nighttime Population | Distance [km] |
| 4 | Aso,Kumamoto | 27,000 | 5 |
The histogram shows frequency distribution of estimated Is derived from interpolation of the observation with 250-m mesh. The daytime and nighttime correspond to 9:00-18:59 and 19:00-8:59, respectively. The distance is measured from the epicenter to the center of the municipality.
Is Exposed-Population Estimates of Each City

5- or greater
Not Available
|
|
6- or greater
Not Available
|

6+ or greater
Not Available
|


Population exposed to Is 5- or greater are not estimated.
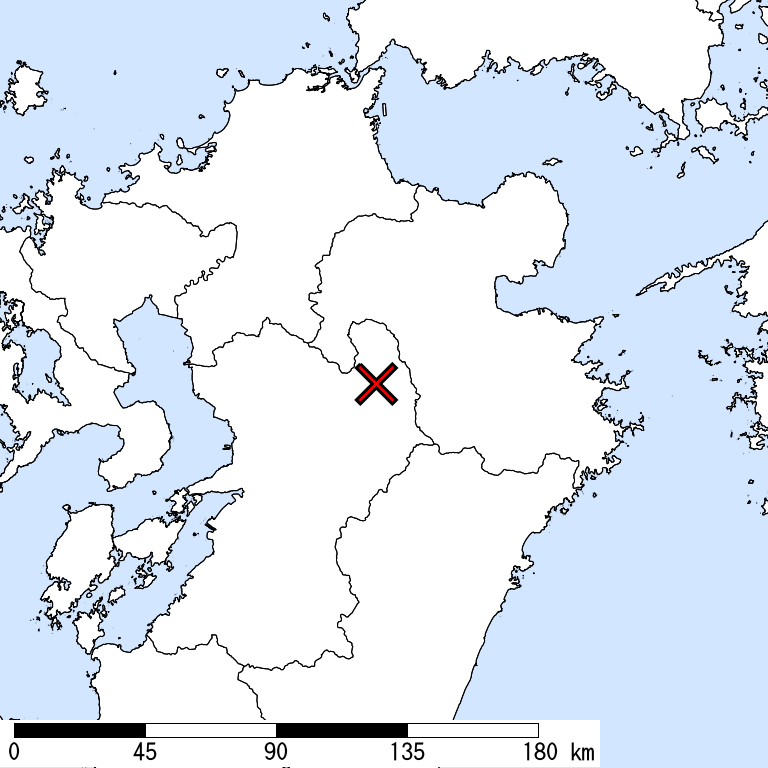
Seismic Hazard Information of J-SHIS
J-SHIS is a Web service by NIED, to help prevent and prepare for earthquake disaster by providing a public portal for seismic hazard information across Japan.
Is Distribution of 2% Probability of Exceedance in 50 Years
Is Distribution of Return Period of 50,000-year


Major Historical Damaging Earthquakes in This Region
| Year | Region | M | Damage |
| 1889 | Western Kumamoto | 6.3 | 239 houses collapsed, 20 dead. |
| 1909 | Western Miyazaki | 7.6 | 4 houses collapsed. |
| 1922 | Tachibana Bay | 6.9 | Shimabara Earthquake,26 dead, 42 injured, 195 houses collapsed, and 459 non-residential houses collapsed in Nagasaki. |
| 1939 | Hyuganada | 6.5 | Minor damage on the coast of Oita. 1 dead in Miyazaki. A small tsunami was observed. |
| 1968 | Satsuma, Kagoshima | 6.1 | Ebino Earthquake,3 dead, 42 injured, 368 houses collapsed, 636 partially destroyed. On the 25th of March, 18 house collapses, 147 partial destructions. |
| 1975 | Aso, Kumamoto | 6.1 | 10 injured in Kumamoto. 16 buildings collapsed, 17 partially destroyed, 12 roads damaged, 15 landslides. |
| 1975 | Western Oita | 6.4 | 22 injured. 58 houses collapsed, and 93 partially destroyed. 182 roads damaged. |
| 2005 | W Off Fukuoka | 7.0 | 1 dead, 1,204 injured, 144 houses collapsed, 353 partially destroyed. |
| 2016 | Kumamoto, Kumamoto | 7.3・6.5 | The 2016 Kumamoto Earthquake, crustal earthquake with right-lateral faults in Futagawa and Hinagu fault zone. 50 dead (not including 45 related death), 2,245 injured, 8,147 houses collapsed, 29,008 partially destroyed (as of Aug. 26, 2016). The maximum Is was 7. |
Reference: National Astronomical Observatory of Japan, Chronological Scientific Tables, Maruzen, (2017) *partially extracted