
Updated: 2023-05-13 16:27:09 (UTC+9)
Ver.7
Final Report
![]()
2023-05-13 16:10 (UTC+9),
NEAR TOKARA ISLANDS,
10km Depth, M 5.1 by JMA
NEAR TOKARA ISLANDS,
10km Depth, M 5.1 by JMA
Is Distribution
Maximum Observed Is:5-
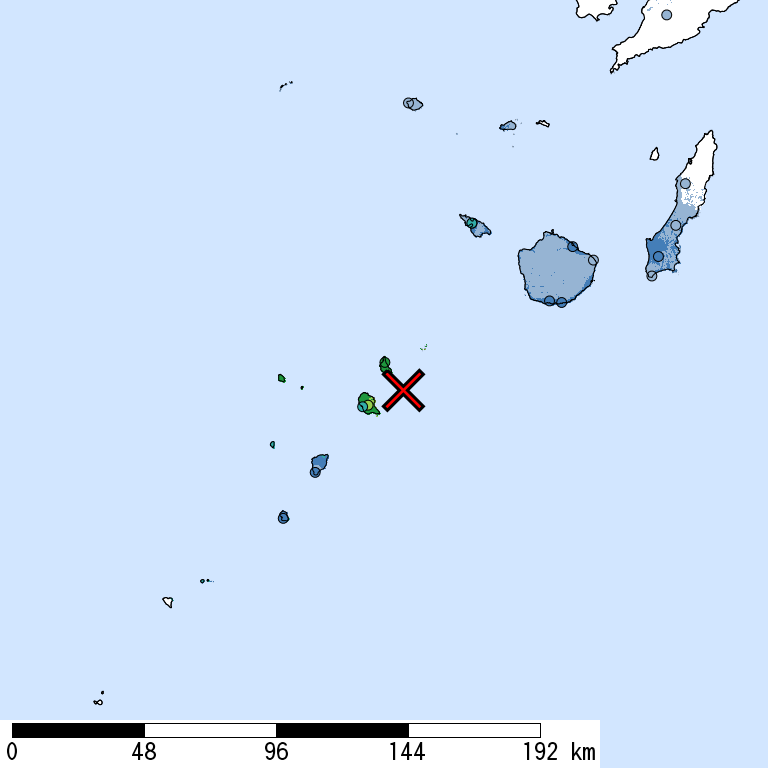
Seismic Intensity (Is) distribution is estimated from the observed data (circles) of NIED K-NET, KiK-net, JMA, and local governments that had been collected by 2023/05/13 16:25:00.
Estimated Is for Major Cities
| Max. Obs. Is | Histogram of Estimated Is |
Municipality
Show All Data | Daytime Population | Distance [km] |
| 5- | Toshima,Kagoshima,Kagoshima | 600 | 15 |
The histogram shows frequency distribution of estimated Is derived from interpolation of the observation with 250-m mesh. The daytime and nighttime correspond to 9:00-18:59 and 19:00-8:59, respectively. The distance is measured from the epicenter to the center of the municipality.
Is Exposed-Population Estimates of Each City

5- or greater
|
|

6- or greater
Not Available
|
6+ or greater
Not Available
|


| Show All Data | ||||
| 5- or greater |
5+ or greater |
6- or greater |
6+ or greater |
|
| Whole of Japan | < 1,000 | |||
| Kagoshima Prefecture | < 1,000 | |||
| Toshima,Kagoshima,Kagoshima | < 1,000 |
The summation of the exposed population for each city does not necessarily equal to that of the prefecture or whole of Japan.
Seismic Hazard Information of J-SHIS
J-SHIS is a Web service by NIED, to help prevent and prepare for earthquake disaster by providing a public portal for seismic hazard information across Japan.
Is Distribution of 2% Probability of Exceedance in 50 Years
Is Distribution of Return Period of 50,000-year


Major Historical Damaging Earthquakes in This Region
No historical damaging earthquake is known in this region.