
Updated: 2023-05-11 04:28:03 (UTC+9)
Ver.5
Final Report
![]()
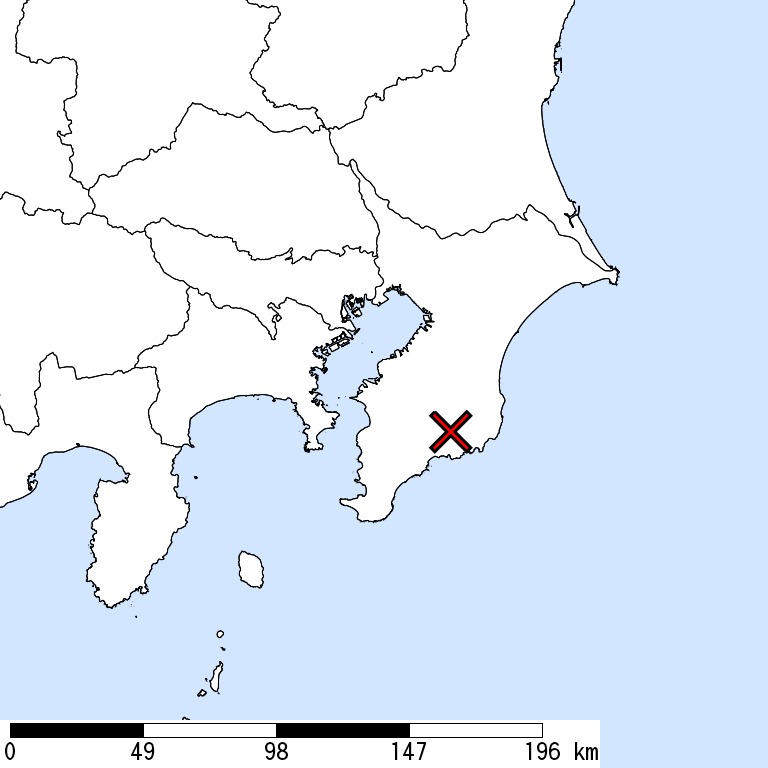
2023-05-11 04:16 (UTC+9),
SOUTHERN CHIBA,
40km Depth, M 5.4 by JMA
SOUTHERN CHIBA,
40km Depth, M 5.4 by JMA
Is Distribution
Maximum Observed Is:5+
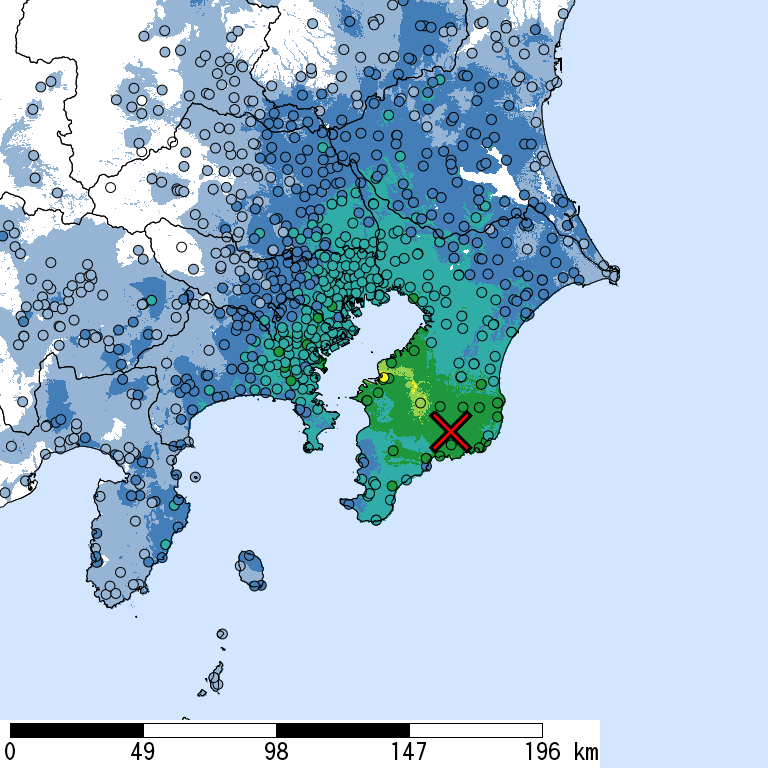
Seismic Intensity (Is) distribution is estimated from the observed data (circles) of NIED K-NET, KiK-net, JMA, and local governments that had been collected by 2023/05/11 04:27:03.
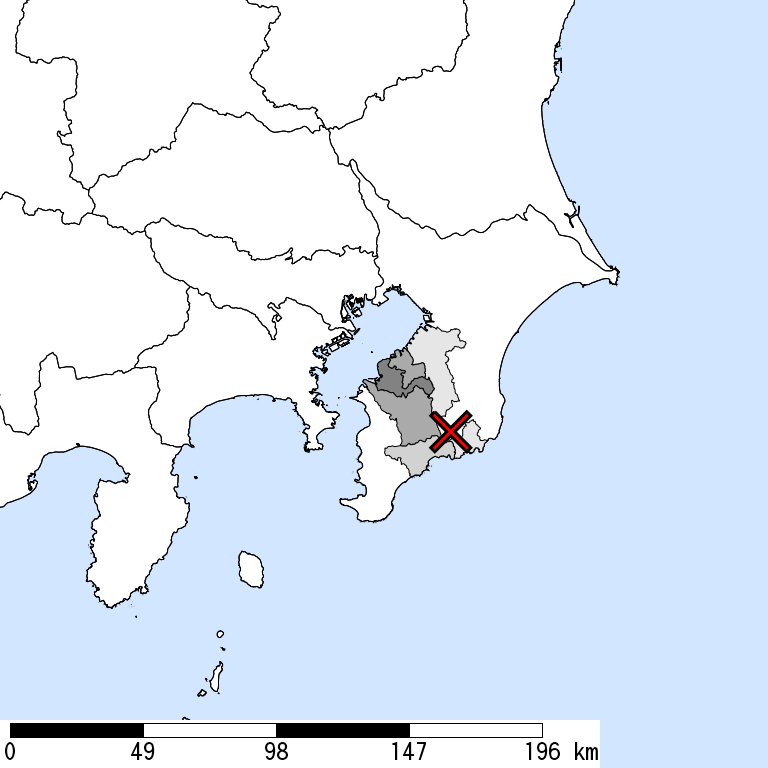
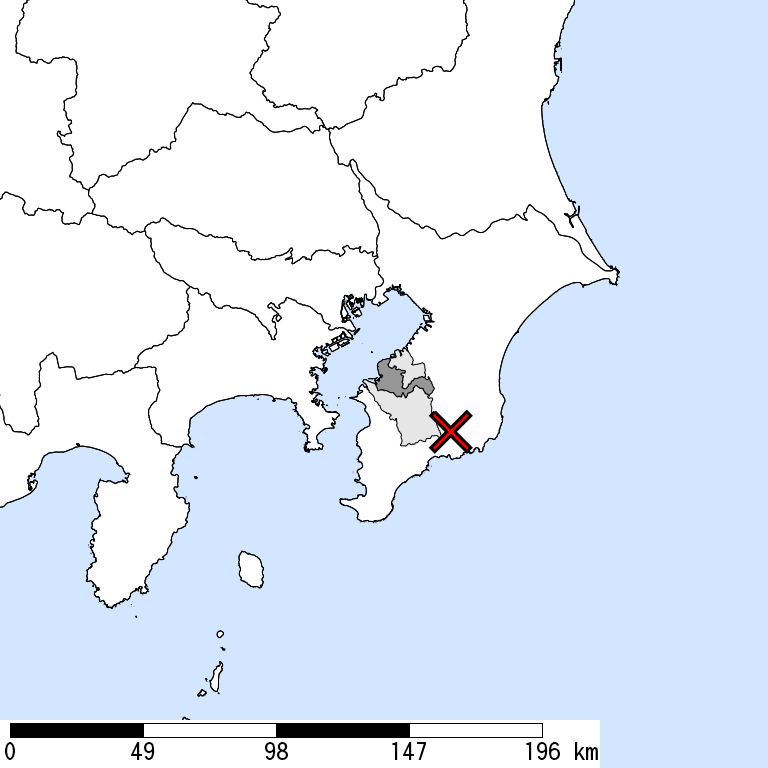
Estimated Is for Major Cities
| Max. Obs. Is | Histogram of Estimated Is |
Municipality
Show All Data | Nighttime Population | Distance [km] |
| 5+ | Kisarazu,Chiba | 130,000 | 32 | |
| 4 | Kanagawa,Yokohama,Kanagawa | 230,000 | 60 | |
| 4 | Ichihara,Chiba | 280,000 | 33 | |
| 4 | Asahi,Yokohama,Kanagawa | 250,000 | 66 | |
| 4 | Totsuka,Yokohama,Kanagawa | 280,000 | 64 | |
| 4 | Shinagawa,Tokyo | 370,000 | 62 | |
| 4 | Nakahara,Kawasaki,Kanagawa | 240,000 | 64 | |
| 3 | Koto,Tokyo | 460,000 | 62 | |
| 3 | Kohoku,Yokohama,Kanagawa | 330,000 | 62 | |
| 3 | Tsurumi,Yokohama,Kanagawa | 270,000 | 58 | |
| 3 | Kanazawa,Yokohama,Kanagawa | 210,000 | 54 | |
| 3 | Ota,Tokyo | 690,000 | 59 | |
| 3 | Adachi,Tokyo | 680,000 | 73 | |
| 3 | Edogawa,Tokyo | 680,000 | 63 | |
| 3 | Funabashi,Chiba | 610,000 | 58 | |
| 3 | Kawaguchi,Saitama | 560,000 | 80 | |
| 3 | Suginami,Tokyo | 550,000 | 75 | |
| 3 | Itabashi,Tokyo | 540,000 | 75 | |
| 3 | Nerima,Tokyo | 710,000 | 77 | |
| 3 | Setagaya,Tokyo | 870,000 | 70 |
The histogram shows frequency distribution of estimated Is derived from interpolation of the observation with 250-m mesh. The daytime and nighttime correspond to 9:00-18:59 and 19:00-8:59, respectively. The distance is measured from the epicenter to the center of the municipality.
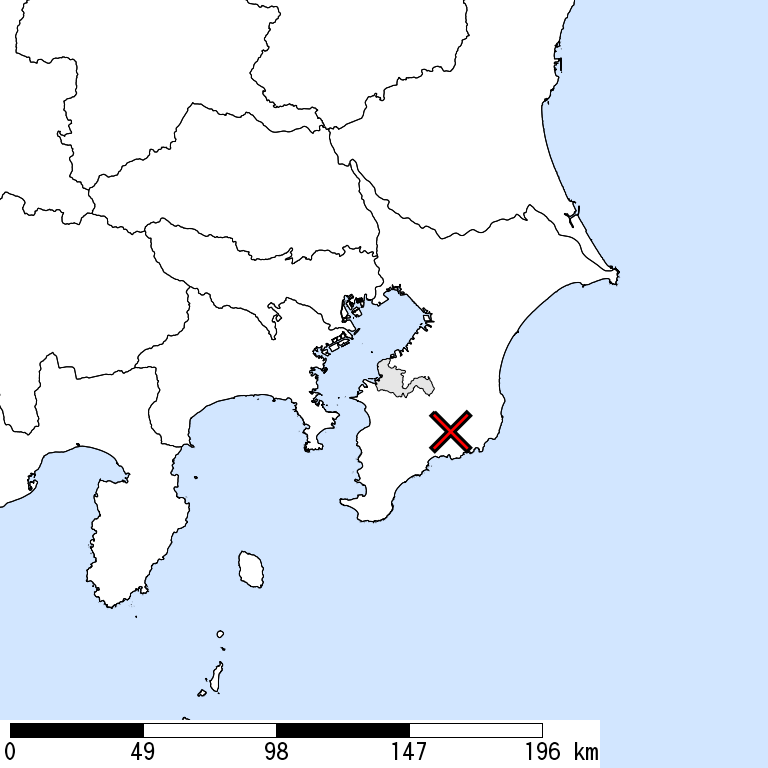
Is Exposed-Population Estimates of Each City
5- or greater
|
|
6- or greater
|
6+ or greater
Not Available
|

| Show All Data | ||||
| 5- or greater |
5+ or greater |
6- or greater |
6+ or greater |
|
| Whole of Japan | 50,000 | 20,000 | < 1,000 | |
| Chiba Prefecture | 50,000 | 20,000 | < 1,000 | |
| Kisarazu,Chiba | 50,000 | 10,000 | < 1,000 | |
| Katsura,Chiba | < 1,000 | |||
| Ichihara,Chiba | < 1,000 | |||
| Kamogawa,Chiba | 2,000 | |||
| Kimitsu,Chiba | 10,000 | 1,000 | ||
| Sodegaura,Chiba | 5,000 | < 1,000 |
The summation of the exposed population for each city does not necessarily equal to that of the prefecture or whole of Japan.
Seismic Hazard Information of J-SHIS
J-SHIS is a Web service by NIED, to help prevent and prepare for earthquake disaster by providing a public portal for seismic hazard information across Japan.
Is Distribution of 2% Probability of Exceedance in 50 Years
Is Distribution of Return Period of 50,000-year


Major Historical Damaging Earthquakes in This Region
| Year | Region | M | Damage |
| 1921 | Southern Ibaraki | 7.0 | Ryugasaki Earthquake,Minor damage in Chiba and Ibaraki such as damage to houses and roads. |
| 1922 | West coast, Chiba | 6.8 | Uragasuido Earthquake,1 dead in Tokyo, 1 dead in Yokohama, Kanagawa. Houses were damaged. |
| 1923 | Western Kanagawa | 7.9 | Kanto Earthquake,The maximum amplitude of 14-20 cm was observed in Tokyo. Over 105,000 dead or missing, over 109,000 houses collapsed, 102,000 partially destroyed, over 212,000 destroyed by fire. Many landslides. Tsunamis struck the coast of Kanto. Wave heights were 12 m in Atami, Sizuoka; 9.3 m in Aihama, Chiba. |
| 1924 | Western Kanagawa | 7.3 | Tanzawa Earthquake,19 dead, over 1,200 houses collapsed. |
| 1978 | Near Izu-Oshima Island | 7.0 | Izu Oshima Kinkai Earthquake,25 dead, 211 injured, 96 houses collapsed, 616 partially destroyed, 1,141 roads damaged, 191 landslides. |
| 1980 | E Off Izu Peninsula | 6.7 | 1 house collapsed, 17 partially damaged, 7 injured in Izu Peninsula. |
| 1987 | E Off Chiba | 6.7 | 2 dead, 161 injured in Chiba. 16 houses collapsed and over 70,000 partially destroyed. Many roads damaged. |
| 2012 | E Off Chiba | 6.1 | The crustal earthquake with normal faults, induced by the 2011 off the Pacific Coast of Tohoku Earthquake. 1 dead, 1 injured. Maximum Is was 5+. |
Reference: National Astronomical Observatory of Japan, Chronological Scientific Tables, Maruzen, (2017) *partially extracted