About J-RISQ earthquake report
J-RISQ earthquake report is a compact summary of information concerning an earthquake disaster based on data estimated by the J-RISQ system
immediately after an earthquake. The report contains the spatial and frequency distributions of seismic intensity ("Is") for cities,
population exposed to certain level of Is,
and historical damaging earthquake data as well as seismic hazard information for the region.
Specific Disclaimer
- The observed Is shown in a J-RISQ earthquake report is not always the same value as the information reported by the JMA (Japan Meteorological Agency).
- The estimated Is is sometimes larger than the maximum observed Is due to the site amplification factors.
- The population data is based on the past survey.
- It may take time to update a municipal merger, and therefore, the old names of cities, towns, and villages may be shown.
About Released reports
| On and after April 2011 |
J-RISQ Real-time earthquake reports
See "Information in a J-RISQ Earthquake Report" for details.
|
| Before April 2011 |
J-RISQ past earthquake reports fabricated by analyzing earthquake information released in the past
Click here for details.
|
How to Use a J-RISQ Earthquake Report
Access with a Laptop or Desktop
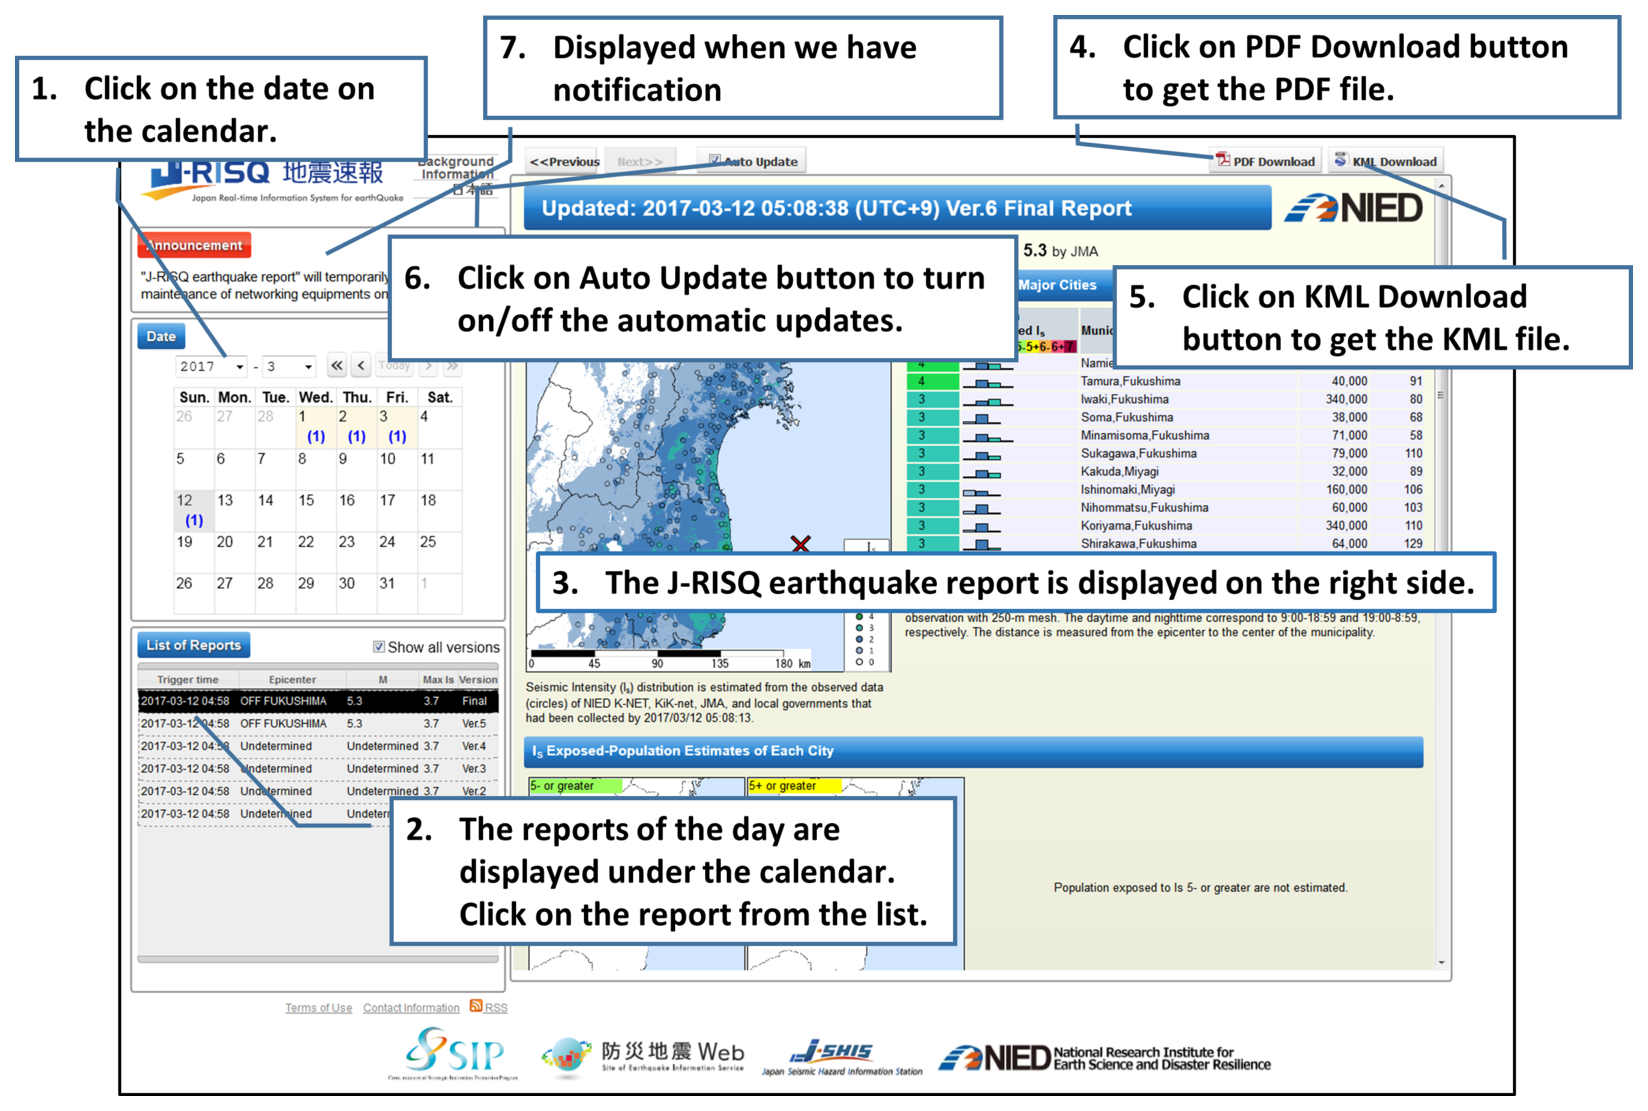
- Access to J-RISQ Report web site.
- 1. Click on the date on the calendar.
- 2. The reports of the day are displayed under the calendar. Click on the report from the list.
- 3. The J-RISQ earthquake report is displayed on the right side.
- 4. Click on PDF Download button to get the PDF file.
- 5. Click on KML Download button to get the KML file.
- 6. Click on Auto Update button to turn on/off the automatic updates.
* If you select a date or select an earthquake, automatic updates turn off.
- 7. Announcement field is displayed when we have notification.
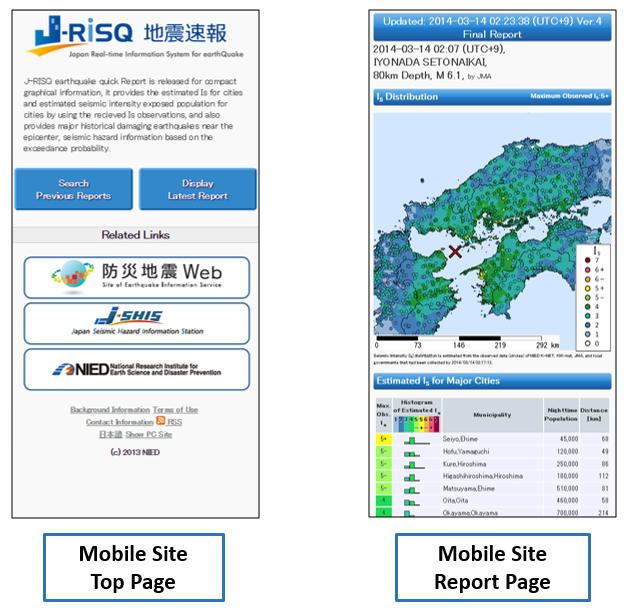
Access with a Smartphone
Accessing web site with a smartphone, the mobile website is shown automatically.
Example of Report
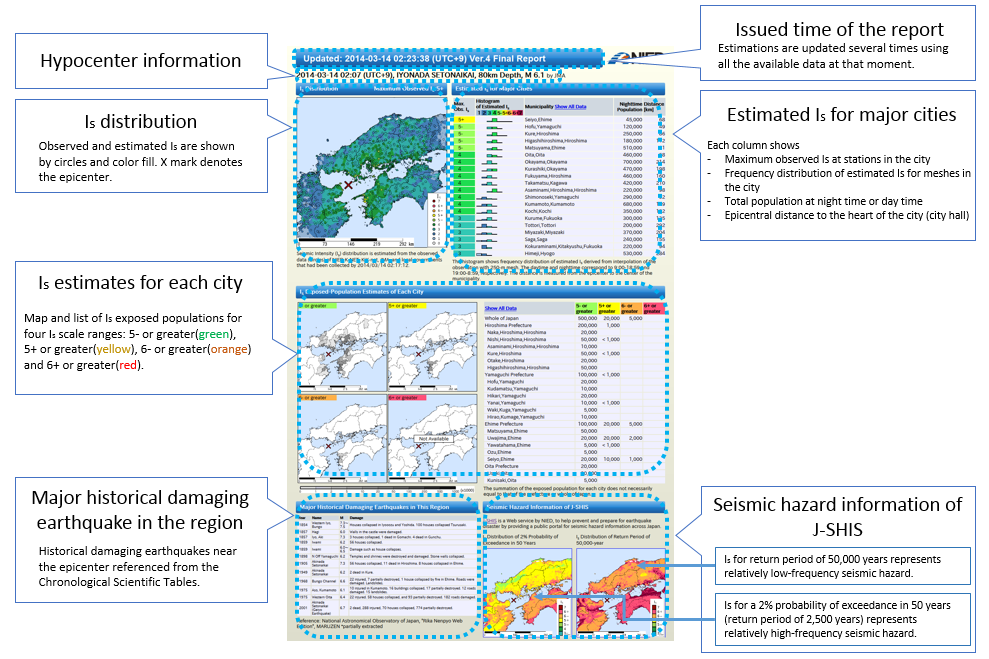
Information in a J-RISQ Earthquake Report
1. Versions
The J-RISQ system is triggered to make a first version of the report when the system receives the Is data of 2.5 or greater from more than 2 stations. The system revises the report versions if the Is data received after making the previous version meet the above-mentioned criteria. Usually, the first version is issued around 1 minute after receiving the first Is data and 3-5 versions are made after that. The system starts to make a final version using all the available data 10 minutes after triggered.
2. Hypocenter Information
A J-RISQ earthquake report shows the hypocenter information provided by the JMA that seems to be related to the shakings or Is data set.
"Undetermined" is displayed if the J-RISQ system does not receive the hypocenter information when making the report.
3. Is Distribution Map
Draw Spatial distribution of Is estimated from the observed data.
| Input data | Output data |
- Observed Is
- Site amplification
- for earthquakes before Dec. 15, 2015
- J-SHIS 250-m mesh site amplification factor (V2)
- for earthquakes before May 15, 2023
- J-SHIS 250-m mesh site amplification factor (V3)
- for earthquakes before Apr. 15, 2025
- J-SHIS 250-m mesh site amplification factor (V4)
- for earthquakes after Apr. 16, 2025
- J-SHIS 250-m mesh site amplification factor (V4, V4.1)
|
- Spatial distribution of Is in 250-m meshes
|
Calculation Process
- Estimate PGV (Peak Ground Velocity) by using the following relationship between Is and PGV (Fujimoto and Midrorikawa, 2005),
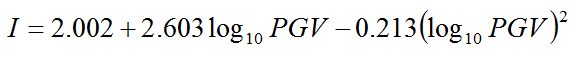 ... (1).
- Estimate PBV (Peak Basement Velocity) by dividing PGV by site amplification factor.
- Estimate spatial distribution of PBV in 250-m meshes in the following methods.
- Reports other than final version
- Delaunay triangular interpolation algorithm (Shewchuk, 1996)
- Final version report
- Inverse distance weighting interpolation algorithm
- Multiply PBV by the amplification factor to derive the PGV distribution and then convert to the Is distribution using the relationship (1).
4. Table of Estimated Is for Major Cities
The table lists the maximum observed Is and frequency distribution (histogram) of the estimated Is for major cities considering the maximum observed value and populations.
| Input data |
- Population data
- for earthquakes before Dec 15, 2015
- Night-time population (19:00-8:59): 2005 national census
- Day-time population (9:00-18:59): 2006 business and enterprise survey
- for earthquakes before May 15, 2023
- Night-time population (19:00-8:59): 2010 national census
- Day-time population (9:00-18:59): 2010 national census and 2009 economic census for business frame
- for earthquakes after May 15, 2023
- Night-time population (19:00-8:59): 2015 national census
- Day-time population (9:00-18:59): 2015 national census and 2014 economic census for business frame
- Administrative district data
- for earthquakes before May 8, 2014
- 2008 administrative district data of National Land Numerical Information
- for earthquakes before Dec 15, 2015
- 2013 administrative district data of National Land Numerical Information
- for earthquakes before May 15, 2023
- 2015 administrative district data of National Land Numerical Information
- for earthquakes after May 15, 2023
- 2019 administrative district data of National Land Numerical Information
|
Estimation Process of Is Frequency Distribution
- Calculate a number of 250-m meshes for each municipality and each Is scale from the estimated Is distribution data.
If the meshes are across the plural municipalities, the number of meshes is allocated to municipalities considering the ratio of the areas.
- Divide the number of 250-m meshes for each Is scale by the total number of the meshes in the municipality and round the number by 5% scale.
5. Maps and Table of Is Exposed Populations for Municipalities and Prefectures
| Input data | Output data |
- Spatial distribution of Is in 250-m meshes
- Population data
- Night-time population (19:00-8:59)
- Day-time population (9:00-18:59)
|
- Is exposed population data for municipalities and prefectures
|
- Pick up the 250-m mesh which experiences a threshold Is.
- Count the exposed population for the Is level in the meshes.
- Calculate a sum of the Is exposed population for each municipality and prefecture.
If the meshes are across the plural municipalities, the populations are allocated to municipalities considering the ratio of the areas.
6. Major Historical Damaging Earthquakes in This Region
Historical damaging earthquakes around the epicenter are referenced from the Chronological Scientific Tables, “Rika Nenpyo Web Edition”, written by National Astronomical Observatory of Japan, published by MARUZEN.
7. Seismic Hazard Information of J-SHIS
Seismic hazard information is referenced from National Seismic Hazard Maps of Japan (2012 model 1) provided by J-SHIS.
J-SHIS is a Web service by NIED, to help prevent and prepare for earthquake disaster by providing a public portal for seismic hazard information across Japan.
Acknowledgments
This work was partially supported by the Council for Science, Technology and Innovation (CSTI) through the Cross-ministerial Strategic Innovation Promotion Program
(SIP), titled "Enhancement of social resiliency against natural disasters" (Funding agency: JST).
We are grateful to the JMA for providing the Is data observed at the JMA and local government stations and hypocenter information.