About J-RISQ past earthquake Report
J-RISQ past earthquake Report is analysis of earthquakes which cause seismic intensity (Is) of 3 or above from May 1996 to March 2011.
See Information in a J-RISQ Earthquake Report for details on J-RISQ Real-time Report on and after April 2011.
1. Earthquake Information
- Is data observed by K-NET or KiK-net
- Is data observed by JMA (Japan Meteorological Agency) or local governments
- Hypocenters
2. Is Distribution Map
Draw Spatial distribution of Is estimated from the observed data.
| Input data | Output data |
- Observed Is
- Site amplification
- J-SHIS 250-m mesh site amplification factor (V2)
|
- Spatial distribution of Is in 250-m meshes
|
Calculation Process
- Estimate PGV (Peak Ground Velocity) by using the following relationship between Is and PGV (Fujimoto and Midrorikawa, 2005),
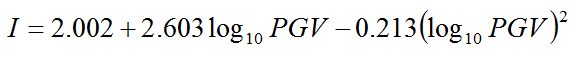 ... (1).
- Estimate PBV (Peak Basement Velocity) by dividing PGV by site amplification factor.
- Estimate spatial distribution of PBV in 250-m meshes by IDW (Inverse distance weighting) interpolation algorithm.
- Multiply PBV by the amplification factor to derive the PGV distribution and then convert to the Is distribution using the relationship (1).
3. Table of Estimated Is for Major Cities
The table lists the maximum observed Is and frequency distribution (histogram) of the estimated Is for major cities considering the maximum observed value and populations.
| Input data |
- Population data
- Night-time population (19:00-8:59): 2005 national census
- Day-time population (9:00-18:59): 2006 business and enterprise survey
- Administrative district data
- 2008 administrative district data of National Land Numerical Information
|
Estimation Process of Is Frequency Distribution
- Calculate a number of 250-m meshes for each municipality and each Is scale from the estimated Is distribution data.
If the meshes are across the plural municipalities, the number of meshes is allocated to municipalities considering the ratio of the areas.
- Divide the number of 250-m meshes for each Is scale by the total number of the meshes in the municipality and round the number by 5% scale.
4. Maps and Table of Is Exposed Populations for Municipalities and Prefectures
| Input data | Output data |
- Spatial distribution of Is in 250-m meshes
- Population data
- Night-time population (19:00-8:59)
- Day-time population (9:00-18:59)
|
- Is exposed population data for municipalities and prefectures
|
- Pick up the 250-m mesh which experiences a threshold Is.
- Count the exposed population for the Is level in the meshes.
- Calculate a sum of the Is exposed population for each municipality and prefecture.
If the meshes are across the plural municipalities, the populations are allocated to municipalities considering the ratio of the areas.
5. Major Historical Damaging Earthquakes in This Region
Historical damaging earthquakes around the epicenter are referenced from the Chronological Scientific Tables, “Rika Nenpyo Web Edition”, written by National Astronomical Observatory of Japan, published by MARUZEN.
6. Seismic Hazard Information of J-SHIS
Seismic hazard information is referenced from National Seismic Hazard Maps of Japan (2016 version) provided by J-SHIS.
J-SHIS is a Web service by NIED, to help prevent and prepare for earthquake disaster by providing a public portal for seismic hazard information across Japan.
Acknowledgments
This work was partially supported by the Council for Science, Technology and Innovation (CSTI) through the Cross-ministerial Strategic Innovation Promotion Program
(SIP), titled "Enhancement of social resiliency against natural disasters" (Funding agency: JST).
We are grateful to the JMA for providing the Is data observed at the JMA and local government stations and hypocenter information.