Updated: 2026-11-08 01:13:21 (UTC+9) Ver.6

2026-11-08 01:04 (UTC+9),
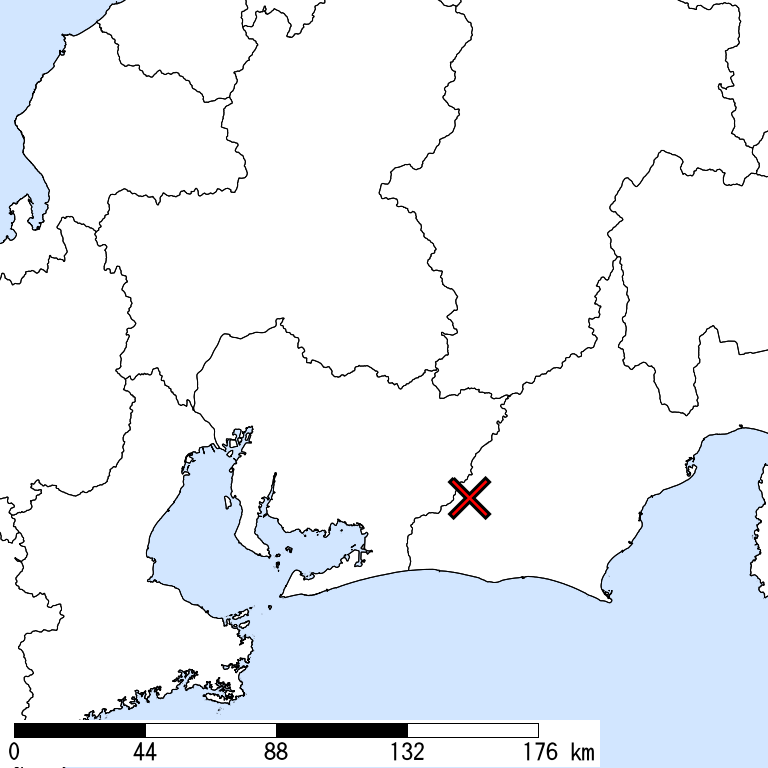
WESTERN SHIZUOKA,
40km Depth,
M 5.7
by JMA
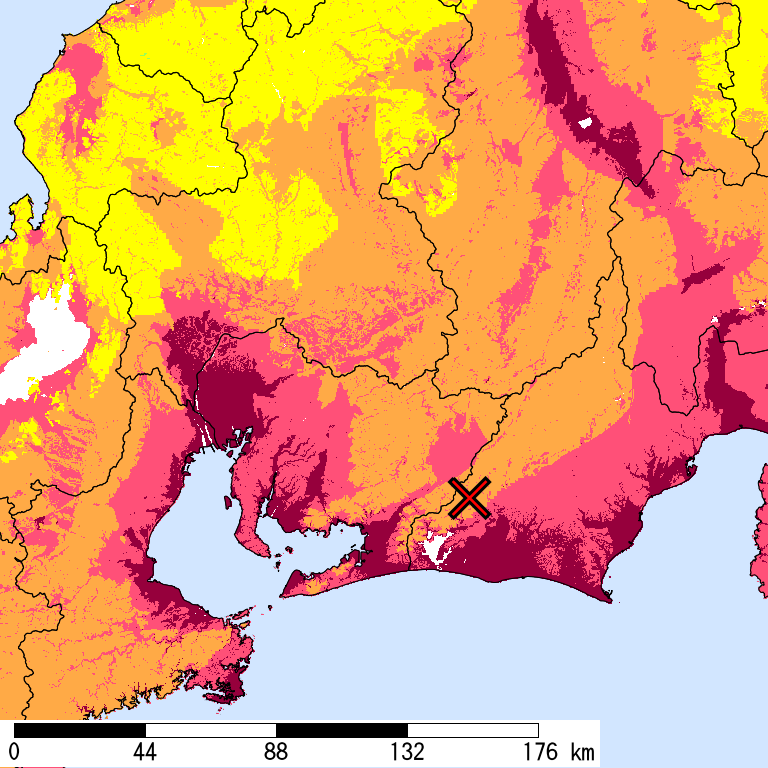
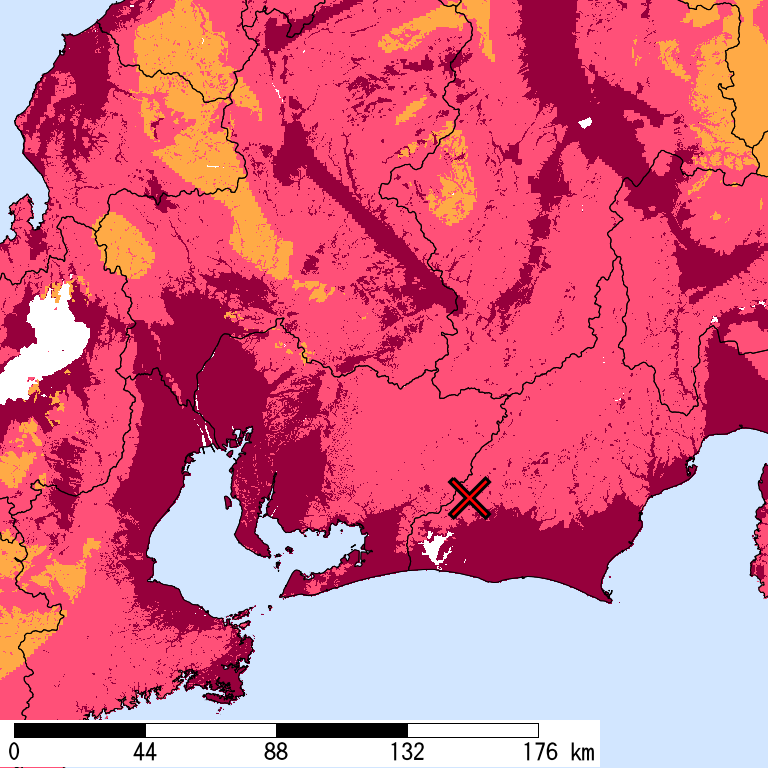
Is Distribution
Maximum Observed Is:5+
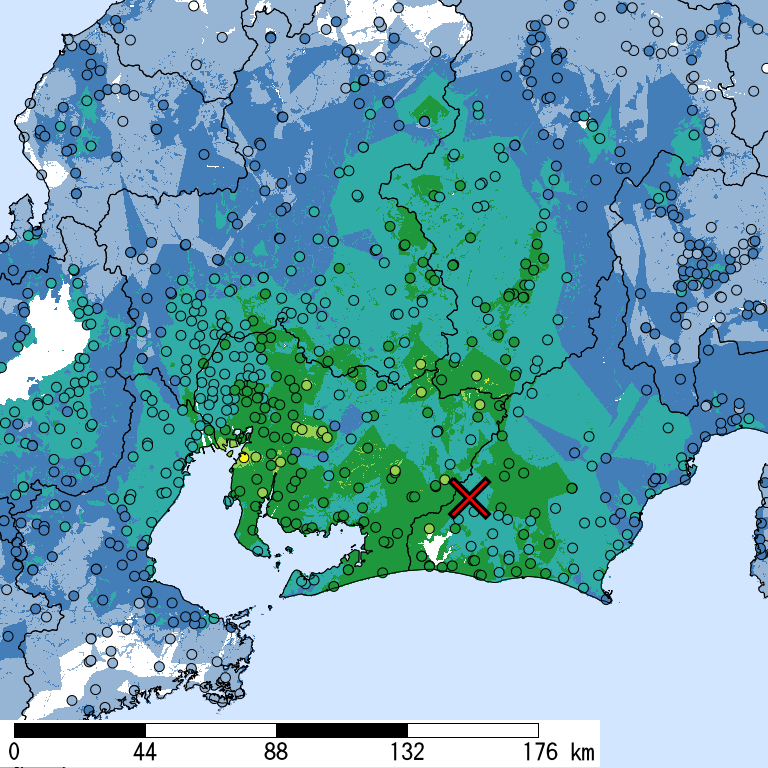
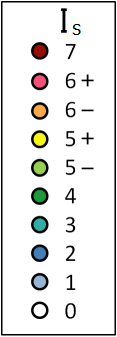
Seismic Intensity (Is) distribution is estimated from the observed data (circles) of NIED K-NET, KiK-net, JMA, and local governments that had been collected by 2026/11/08 01:13:02.
Estimated Is for Major Cities
| Max. Obs. Is | Histogram of Estimated Is |
Municipality Show All Data | Nighttime Population | Distance [km] |
| 5+ | Chita,Aichi | 85,000 | 77 | |
| 5- | Toyota,Aichi | 420,000 | 53 | |
| 5- | Seto,Aichi | 130,000 | 67 | |
| 5- | Tokai,Aichi | 110,000 | 74 | |
| 5- | Kariya,Aichi | 150,000 | 64 | |
| 5- | Handa,Aichi | 120,000 | 69 | |
| 4 | Toyohashi,Aichi | 380,000 | 31 | |
| 4 | Okazaki,Aichi | 380,000 | 48 | |
| 4 | Midori,Nagoya,Aichi | 240,000 | 71 | |
| 4 | Naka,Hamamatsu,Shizuoka | 240,000 | 20 | |
| 4 | Ichinomiya,Aichi | 380,000 | 93 | |
| 4 | Kasugai,Aichi | 310,000 | 77 | |
| 3 | Nakagawa,Nagoya,Aichi | 220,000 | 81 | |
| 3 | Gifu,Gifu | 400,000 | 103 | |
| 3 | Shimizu,Shizuoka,Shizuoka | 240,000 | 72 | |
| 3 | Fushimi,Kyoto,Kyoto | 280,000 | 177 | |
| 3 | Yokkaichi,Mie | 310,000 | 98 | |
| 3 | Tsu,Mie | 280,000 | 111 | |
| 3 | Fuji,Shizuoka | 250,000 | 93 | |
| 3 | Otsu,Shiga | 340,000 | 168 |
The histogram shows frequency distribution of estimated Is derived from interpolation of the observation with 250-m mesh. The daytime and nighttime correspond to 9:00-18:59 and 19:00-8:59, respectively. The distance is measured from the epicenter to the center of the municipality.
Is Exposed-Population Estimates of Each City
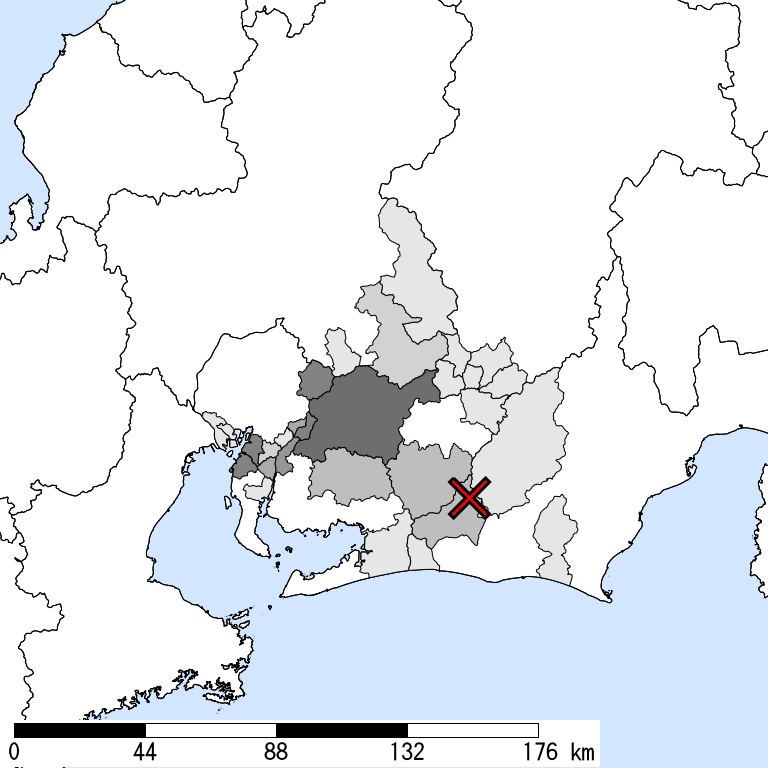
5- or greater
|
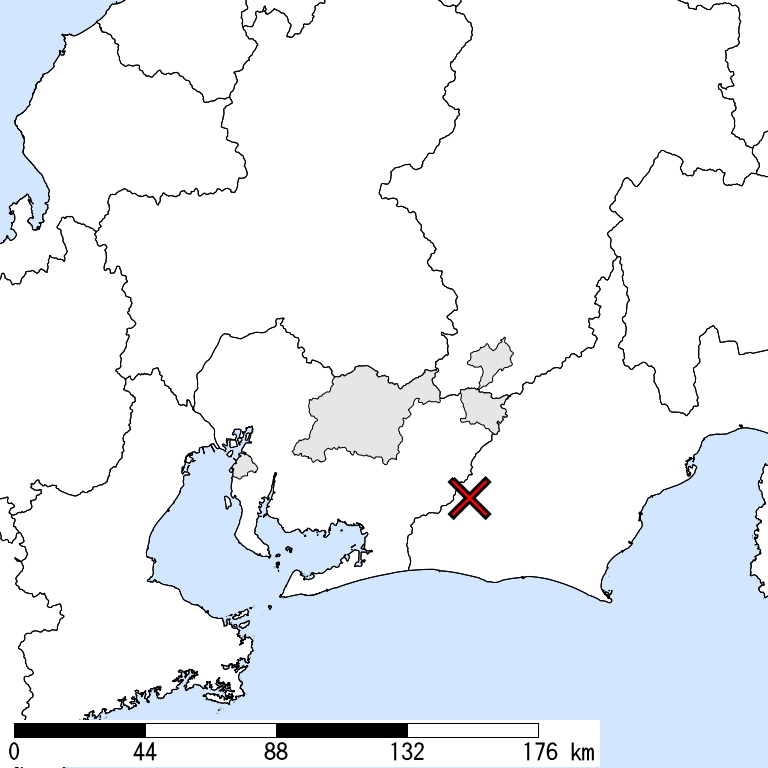
5+ or greater
|
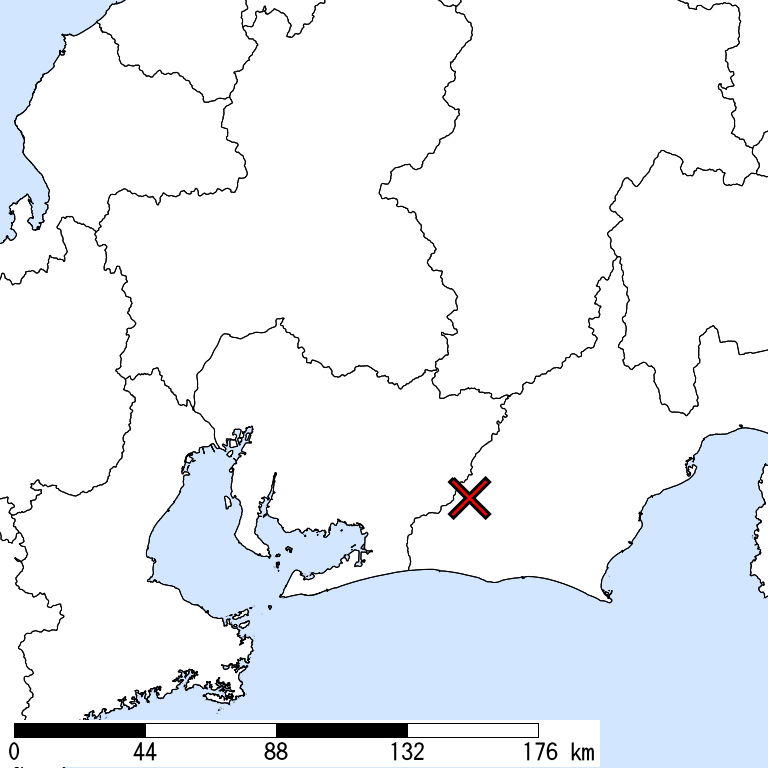
6- or greater
Not Available
|
6+ or greater
Not Available
|

| Show All Data | ||||
| 5- or greater |
5+ or greater |
6- or greater |
6+ or greater |
|
| Whole of Japan | 200,000 | < 1,000 | ||
| Nagano Prefecture | 1,000 | < 1,000 | ||
| Anan,Shimoina,Nagano | 1,000 | < 1,000 | ||
| Urugi,Shimoina,Nagano | < 1,000 | |||
| Gifu Prefecture | 1,000 | |||
| Ena,Gifu | 1,000 | |||
| Toki,Gifu | < 1,000 | |||
| Shizuoka Prefecture | 2,000 | |||
| Kita,Hamamatsu,Shizuoka | 2,000 | |||
| Kakegawa,Shizuoka | < 1,000 | |||
| Kosai,Shizuoka | < 1,000 | |||
| Aichi Prefecture | 200,000 | < 1,000 | ||
| Okazaki,Aichi | 2,000 | |||
| Seto,Aichi | 20,000 | |||
| Kariya,Aichi | 20,000 | |||
| Toyota,Aichi | 50,000 | < 1,000 | ||
| Shinshiro,Aichi | 5,000 | |||
| Tokai,Aichi | 20,000 | |||
| Obu,Aichi | 2,000 | |||
| Chita,Aichi | 50,000 | < 1,000 | ||
| Miyoshi,Aichi | 20,000 | |||
| Togo,Aichi,Aichi | 5,000 | |||
| Higashiura,Chita,Aichi | 10,000 | |||
| Toyone,Kitashitara,Aichi | < 1,000 | < 1,000 |
The summation of the exposed population for each city does not necessarily equal to that of the prefecture or whole of Japan.
Major Historical Damaging Earthquakes in This Region
| Year | Region | M | Damage |
| 1917 | Central Shizuoka | 6.3 | Brick walls, brick chimneys were damaged. 2 dead. |
| 1935 | Central Shizuoka | 6.4 | Shizuoka Earthquake,9 dead. 363 houses collapsed, 451 non-residential houses collapsed. Quay wall and depots wrecked at Shimizu port. |
| 1945 | Mikawa Bay | 6.8 | Mikawa Earthquake,2306 dead, 7,221 houses collapsed, 16,555 partially destroyed. A tsunami had maximum runup heights of 1 m in Gamagoori. |
| 1965 | Central Shizuoka | 6.1 | Shizuoka Earthquake,2 dead, 4 injured. 9 houses damaged. |
| 1969 | Western And Central Mino, Gifu | 6.6 | 1 dead, 10 injured, 86 houses damaged. |
| 1974 | S Off Izu Peninsula | 6.9 | Izuhanto-oki Earthquake,30 dead, 102 injured, 134 houses collapsed, 240 partially collapsed, 5 collapsed by fire. |
| 1984 | Southern Nagano | 6.8 | Naganoken Seibu Earthquake,29 dead, 10 injured. 14 house outflows or collapses, 73 partially destroyed, 565 damaged. 258 roads damaged. |
| 2009 | Suruga Bay | 6.5 | 1 dead, 319 injured. 6 houses partially destroyed (as of March 2010). The maximum Is was 6- (4 cities in Shizuoka). A tsunami with a maximum height of 0.4 m in Omaezaki. |
Reference: National Astronomical Observatory of Japan, Chronological Scientific Tables, Maruzen, (2017) *partially extracted
Seismic Hazard Information of J-SHIS
J-SHIS is a Web service by NIED, to help prevent and prepare for earthquake disaster by providing a public portal for seismic hazard information across Japan.