Updated: 2026-10-29 00:12:51 (UTC+9) Ver.7

2026-10-29 00:07 (UTC+9),
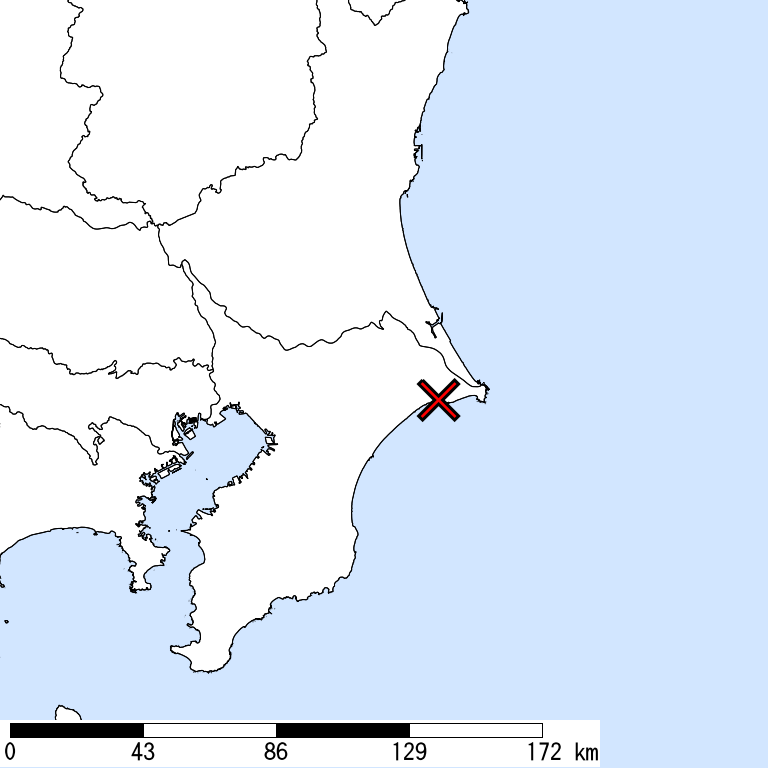
NE CHIBA,
50km Depth,
M 5.4
by JMA
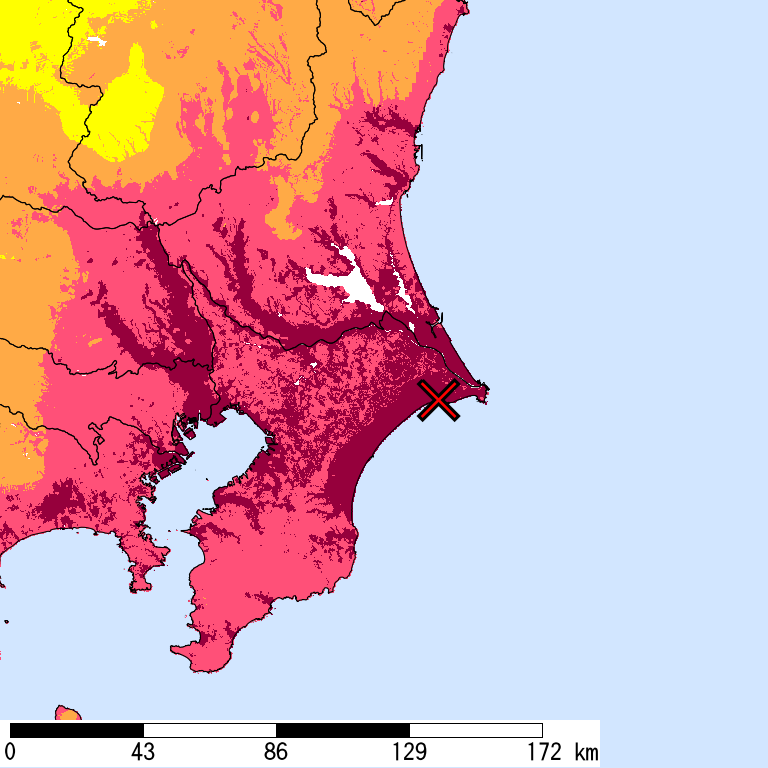
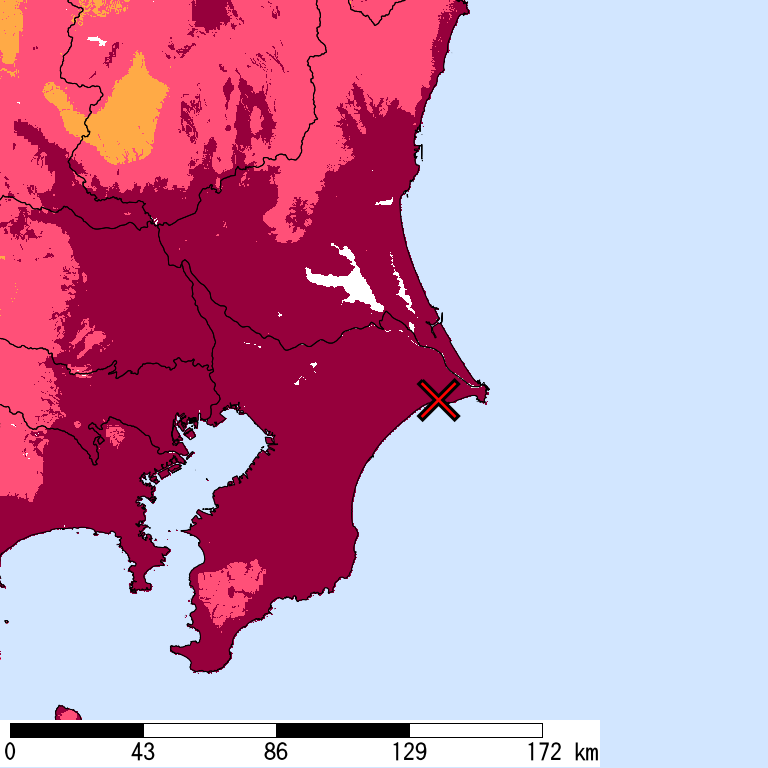
Is Distribution
Maximum Observed Is:5-
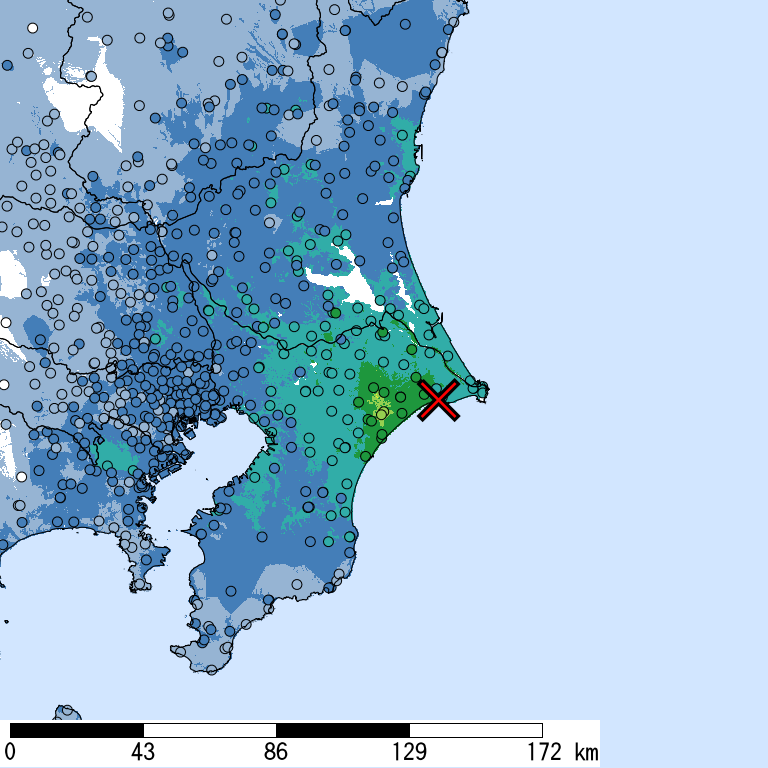
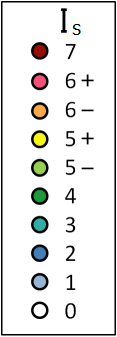
Seismic Intensity (Is) distribution is estimated from the observed data (circles) of NIED K-NET, KiK-net, JMA, and local governments that had been collected by 2026/10/29 00:12:36.
Estimated Is for Major Cities
| Max. Obs. Is | Histogram of Estimated Is |
Municipality Show All Data | Nighttime Population | Distance [km] |
| 5- | Yokoshibahikari,Sambu,Chiba | 24,000 | 18 | |
| 4 | Sammu,Chiba | 53,000 | 28 | |
| 4 | Asahi,Chiba | 66,000 | 5 | |
| 3 | Narita,Chiba | 130,000 | 35 | |
| 3 | Sakura,Chiba | 170,000 | 43 | |
| 3 | Asahi,Yokohama,Kanagawa | 250,000 | 107 | |
| 3 | Toride,Ibaraki | 110,000 | 63 | |
| 3 | Mihama,Chiba,Chiba | 150,000 | 58 | |
| 3 | Ichihara,Chiba | 270,000 | 57 | |
| 3 | Wakaba,Chiba,Chiba | 150,000 | 49 | |
| 3 | Chuo,Chiba,Chiba | 210,000 | 53 | |
| 3 | Tsuchiura,Ibaraki | 140,000 | 61 | |
| 3 | Kisarazu,Chiba | 130,000 | 79 | |
| 3 | Midori,Chiba,Chiba | 130,000 | 49 | |
| 3 | Kanagawa,Yokohama,Kanagawa | 240,000 | 100 | |
| 3 | Hanamigawa,Chiba,Chiba | 170,000 | 57 | |
| 3 | Hitachinaka,Ibaraki | 160,000 | 79 | |
| 3 | Yachiyo,Chiba | 190,000 | 54 | |
| 3 | Noda,Chiba | 150,000 | 80 | |
| 3 | Midori,Saitama,Saitama | 120,000 | 93 |
The histogram shows frequency distribution of estimated Is derived from interpolation of the observation with 250-m mesh. The daytime and nighttime correspond to 9:00-18:59 and 19:00-8:59, respectively. The distance is measured from the epicenter to the center of the municipality.
Is Exposed-Population Estimates of Each City
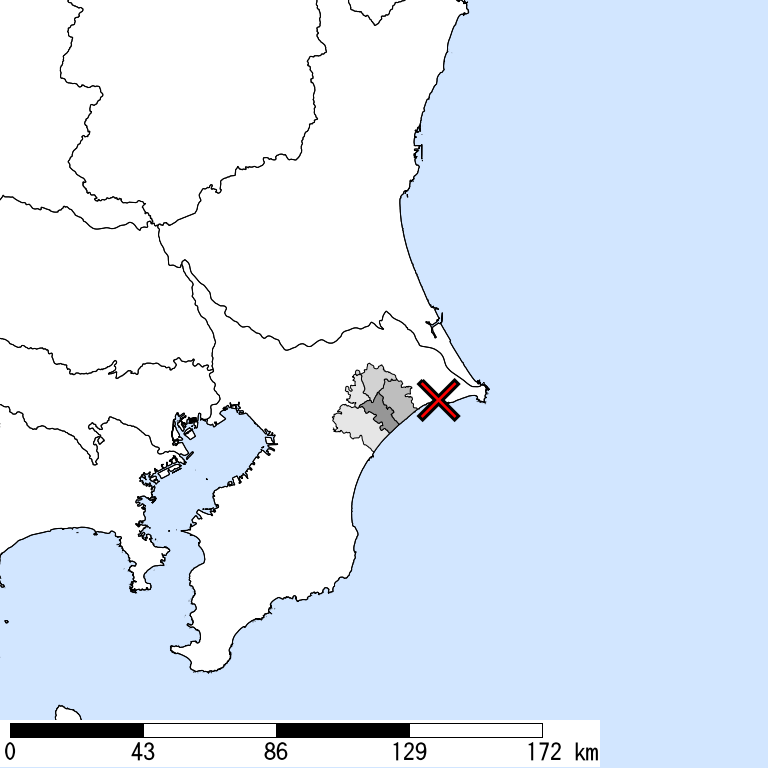
5- or greater
|
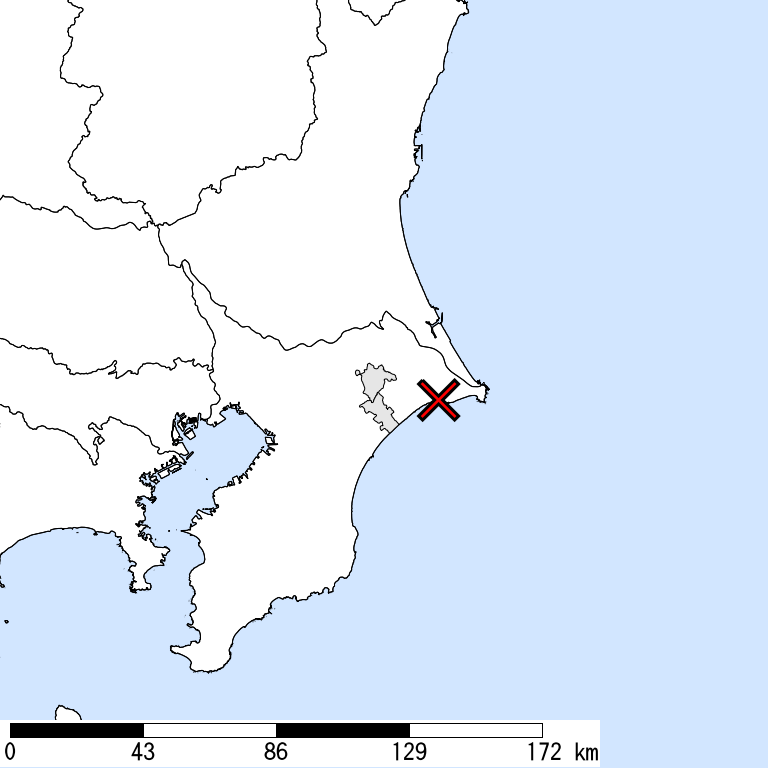
5+ or greater
|
6- or greater
Not Available
|
6+ or greater
Not Available
|

| Show All Data | ||||
| 5- or greater |
5+ or greater |
6- or greater |
6+ or greater |
|
| Whole of Japan | 20,000 | < 1,000 | ||
| Chiba Prefecture | 20,000 | < 1,000 | ||
| Sosa,Chiba | 2,000 | |||
| Sammu,Chiba | < 1,000 | |||
| Tako,Katori,Chiba | 1,000 | < 1,000 | ||
| Shibayama,Sambu,Chiba | < 1,000 | |||
| Yokoshibahikari,Sambu,Chiba | 10,000 | < 1,000 |
The summation of the exposed population for each city does not necessarily equal to that of the prefecture or whole of Japan.
Major Historical Damaging Earthquakes in This Region
| Year | Region | M | Damage |
| 1884 | Near Tokyo | -- | Many chimneys fell down. Brick walls were cracked. |
| 1894 | Eastern Tokyo | 7.0 | Tokyo Earthquake,Many houses collapsed in Kanda, Honjo, and Fukagawa. 24 dead in Tokyo, 7 dead in Kawasaki and Yokohama in Kanagawa. |
| 1895 | Southern Ibaraki | 7.2 | 53 collapses (43 houses and 10 depots), 6 dead. |
| 1915 | Boso Peninsula | 6.0 | Some landslides. 5 injured, some houses collapsed. |
| 1921 | Southern Ibaraki | 7.0 | Ryugasaki Earthquake,Minor damage in Chiba and Ibaraki such as damage to houses and roads. |
| 1922 | West coast, Chiba | 6.8 | Uragasuido Earthquake,1 dead in Tokyo, 1 dead in Yokohama, Kanagawa. Houses were damaged. |
| 1938 | Off Ibaraki | 7.0 | 250 houses damaged in Fukushima. 1 depot collapsed in Ibaraki. A small tsunami was observed. |
| 1987 | E Off Chiba | 6.7 | 2 dead, 161 injured in Chiba. 16 houses collapsed and over 70,000 partially destroyed. Many roads damaged. |
| 2012 | E Off Chiba | 6.1 | The crustal earthquake with normal faults, induced by the 2011 off the Pacific Coast of Tohoku Earthquake. 1 dead, 1 injured. Maximum Is was 5+. |
Reference: National Astronomical Observatory of Japan, Chronological Scientific Tables, Maruzen, (2017) *partially extracted
Seismic Hazard Information of J-SHIS
J-SHIS is a Web service by NIED, to help prevent and prepare for earthquake disaster by providing a public portal for seismic hazard information across Japan.