Updated: 2026-08-23 22:56:11 (UTC+9) Ver.6 Final Report

2026-08-23 22:45 (UTC+9),
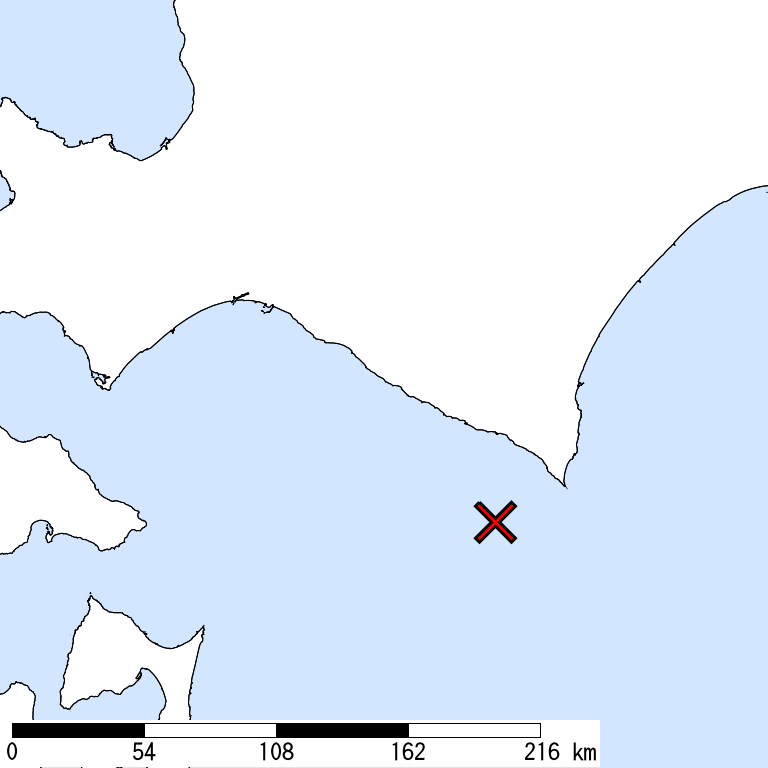
OFF URAKAWA,
40km Depth,
M 6.0
by JMA
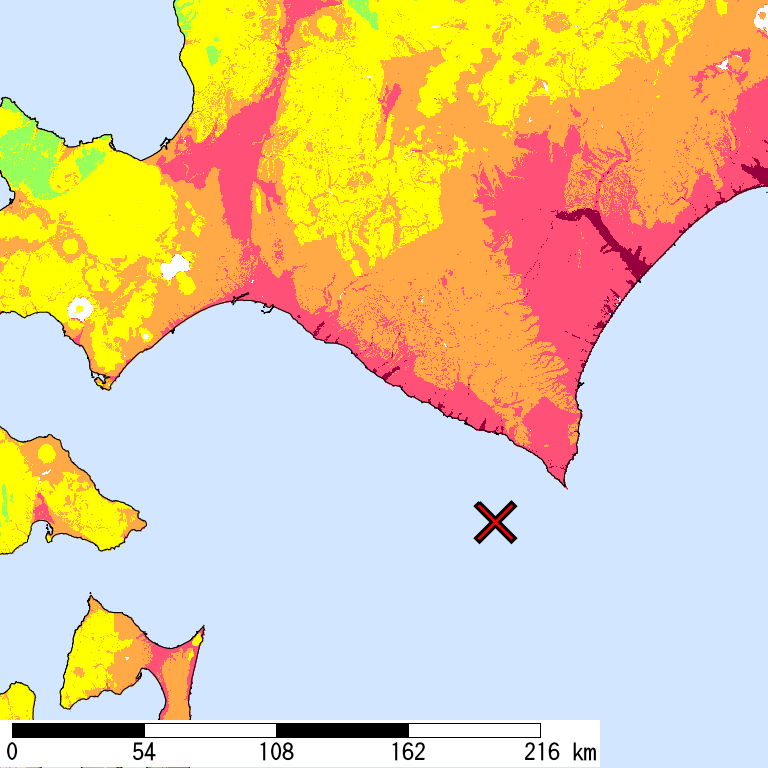
Is Distribution
Maximum Observed Is:4
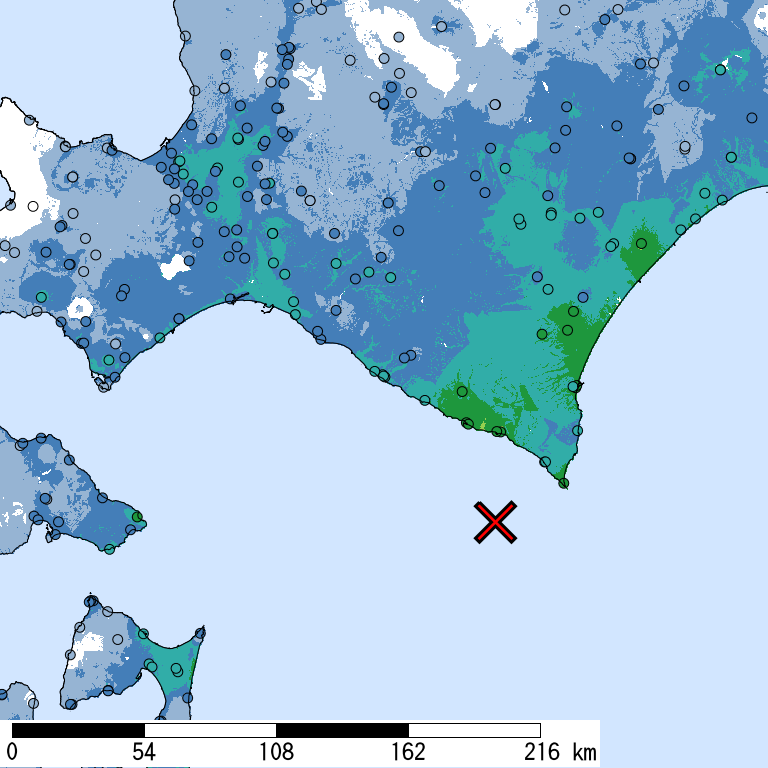
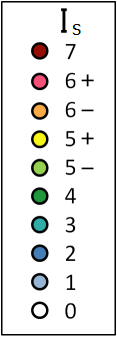
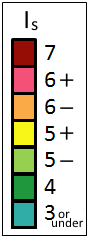
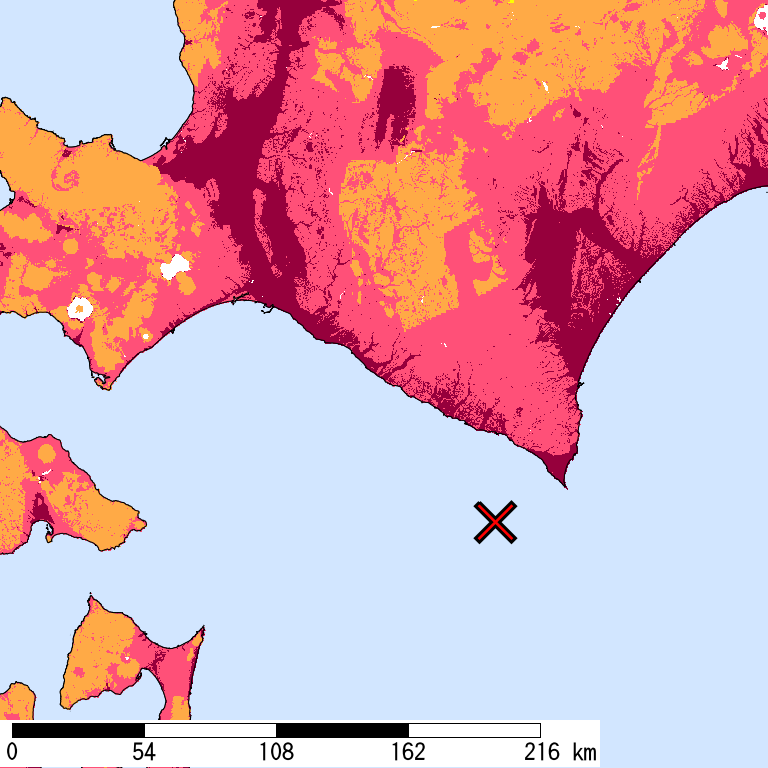
Seismic Intensity (Is) distribution is estimated from the observed data (circles) of NIED K-NET, KiK-net, JMA, and local governments that had been collected by 2026/08/23 22:55:23.
Estimated Is for Major Cities
| Max. Obs. Is | Histogram of Estimated Is |
Municipality Show All Data | Nighttime Population | Distance [km] |
| 4 | Samani,Samani,Hokkaido | 4,500 | 36 | |
| 4 | Hakodate,Hokkaido | 270,000 | 180 | |
| 4 | Makubetsu,Nakagawa,Hokkaido | 27,000 | 128 | |
| 3 | Kushiro,Hokkaido | 170,000 | 179 | |
| 3 | Shinhidaka,Hidaka,Hokkaido | 23,000 | 74 | |
| 3 | Hachinohe,Aomori | 230,000 | 185 | |
| 3 | Morioka,Iwate | 300,000 | 275 | |
| 3 | Mutsu,Aomori | 59,000 | 153 | |
| 3 | Ebetsu,Hokkaido | 120,000 | 183 | |
| 3 | Higashi,Sapporo,Hokkaido | 260,000 | 190 | |
| 3 | Muroran,Hokkaido | 88,000 | 169 | |
| 3 | Obihiro,Hokkaido | 170,000 | 127 | |
| 3 | Kitahiroshima,Hokkaido | 60,000 | 171 | |
| 3 | Kita,Sapporo,Hokkaido | 290,000 | 192 |
The histogram shows frequency distribution of estimated Is derived from interpolation of the observation with 250-m mesh. The daytime and nighttime correspond to 9:00-18:59 and 19:00-8:59, respectively. The distance is measured from the epicenter to the center of the municipality.
Is Exposed-Population Estimates of Each City
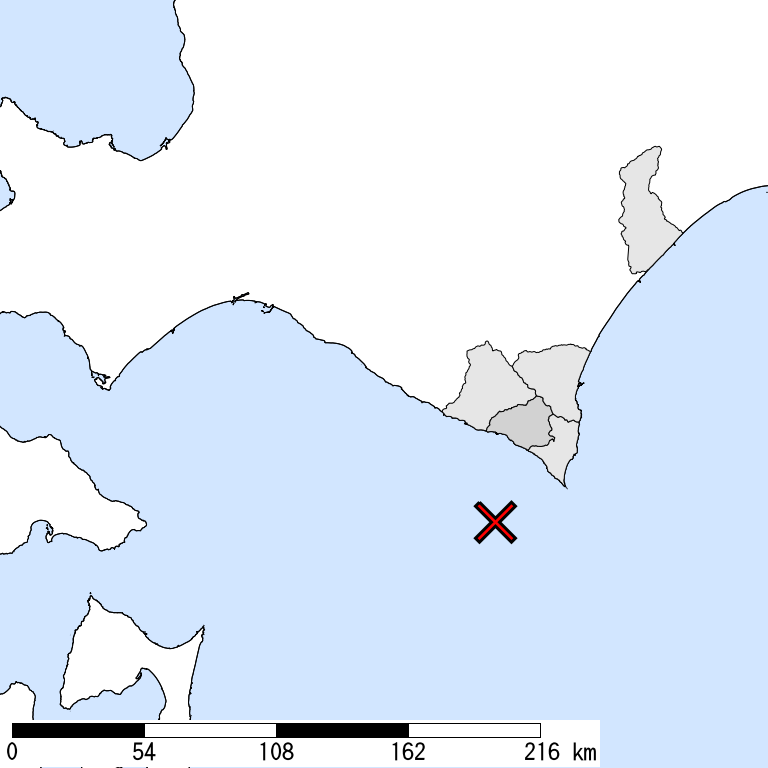
5- or greater
|
5+ or greater
Not Available
|
6- or greater
Not Available
|
6+ or greater
Not Available
|

| Show All Data | ||||
| 5- or greater |
5+ or greater |
6- or greater |
6+ or greater |
|
| Whole of Japan | 2,000 | |||
| Hokkaido Prefecture | 2,000 | |||
| Urakawa,Urakawa,Hokkaido | 1,000 | |||
| Samani,Samani,Hokkaido | 1,000 | |||
| Erimo,Horoizumi,Hokkaido | < 1,000 | |||
| Hiro,Hiro,Hokkaido | < 1,000 | |||
| Urahoro,Tokachi,Hokkaido | < 1,000 |
The summation of the exposed population for each city does not necessarily equal to that of the prefecture or whole of Japan.
Major Historical Damaging Earthquakes in This Region
| Year | Region | M | Damage |
| 1856 | Hidaka, Iburi, Watarishima, Tsugaru, Nanbu | 7.5 | Ansei Hachinohe-oki Earthquake,Tsunamis struck Sanriku and the southern coast of Hokkaido. 93 outflows, 106 houses collapsed, 26 drowned in Nanbu Domain. 3 dead in Hachinohe Domain. |
| 1915 | Off Tokachi | 7.0 | 1 dead, 1 house collapsed. |
| 1945 | E Off Aomori | 7.1 | 2 house collapsed, 2 dead in Aomori. The total amplitude of the tsunami was 35 cm. |
| 1952 | Off Kushiro | 8.2 | Tokachi-oki Earthquake,Tsunami with heights of 3m in Hokkaido and 1-2 m on the Sanriku coast. 28 dead, 5 missing, 815 houses collapsed, 1,324 partially destroyed, 91 outflows. |
| 1962 | Off Tokachi | 7.1 | 2 building collapses and some minor damage. |
| 1968 | E Off Aomori | 7.9 | Tokachi-oki Earthquake,52 dead, 330 injured, 673 houses collapsed, 3,004 partially destroyed. Observed tsunami heights were 3-5 m on the Sanriku Coast and 3 m on Cape Erimo. |
| 1970 | Southern Tokachi | 6.7 | 32 injured, 2 houses collapsed, 7 partially destroyed, 139 partially damaged. |
| 1982 | Off Urakawa | 7.1 | Uraga-oki Earthquake,167 injured, 9 buildings collapsed, 16 partially destroyed, 174 partially damaged, 45 railways damaged. A small tsunami was observed. |
| 2003 | Off Kushiro | 8.0 | Tokachi-oki Earthquake,1 dead, 1 missing, 849 injured, 116 houses collapsed, 368 partially destroyed. The maximum S was 6- (9 cities in Hokkaido). A tsunami whose maximum height was 4m hit Hokkaido and the Pacific coast of Honshu. |
Reference: National Astronomical Observatory of Japan, Chronological Scientific Tables, Maruzen, (2017) *partially extracted
Seismic Hazard Information of J-SHIS
J-SHIS is a Web service by NIED, to help prevent and prepare for earthquake disaster by providing a public portal for seismic hazard information across Japan.