Updated: 2026-04-29 16:50:15 (UTC+9) Ver.4

2026-04-29 16:45 (UTC+9),
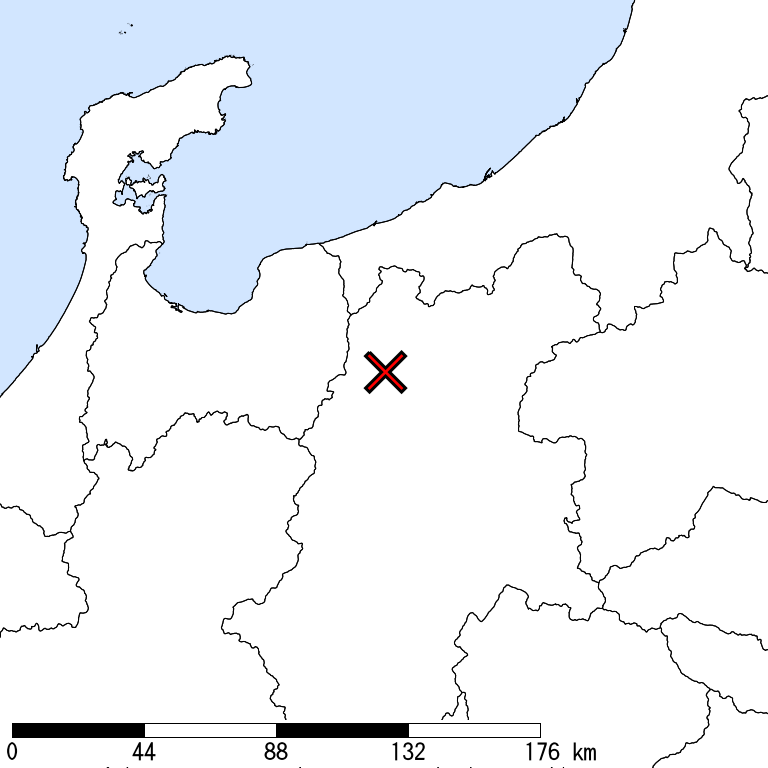
NORTHERN NAGANO,
10km Depth,
M 3.4
by JMA
Is Distribution
Maximum Observed Is:3
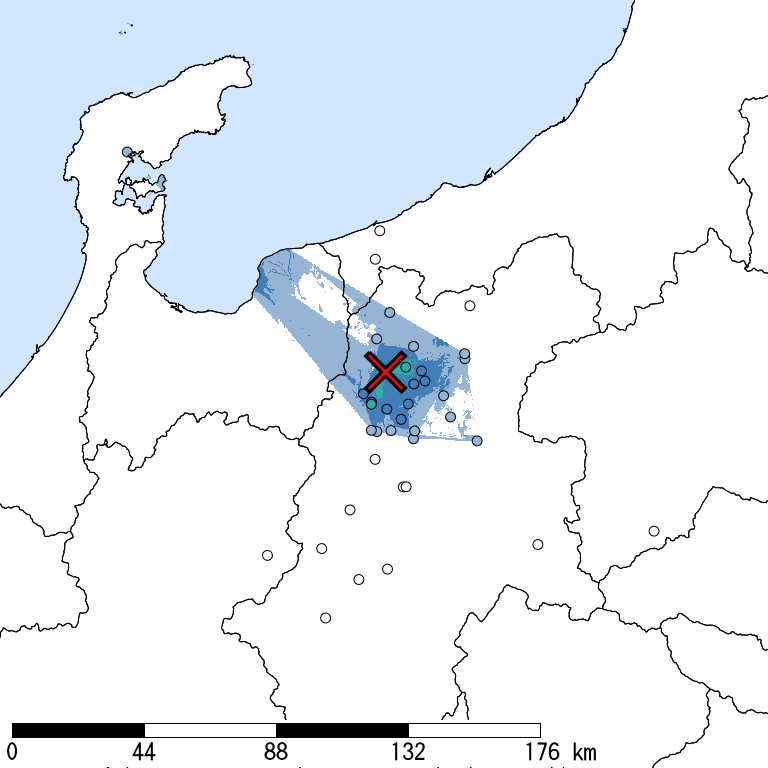
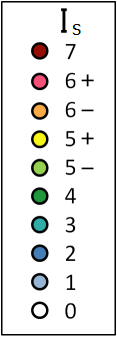
Seismic Intensity (Is) distribution is estimated from the observed data (circles) of NIED K-NET, KiK-net, JMA, and local governments that had been collected by 2026/04/29 16:50:09.
Estimated Is for Major Cities
| Max. Obs. Is | Histogram of Estimated Is |
Municipality Show All Data | Daytime Population | Distance [km] |
| 3 | Ogawa,Kamiminochi,Nagano | 2,300 | 6 | |
| 3 | Omachi,Nagano | 29,000 | 11 |
The histogram shows frequency distribution of estimated Is derived from interpolation of the observation with 250-m mesh. The daytime and nighttime correspond to 9:00-18:59 and 19:00-8:59, respectively. The distance is measured from the epicenter to the center of the municipality.
Is Exposed-Population Estimates of Each City
5- or greater
Not Available
|
5+ or greater
Not Available
|
6- or greater
Not Available
|
6+ or greater
Not Available
|

Population exposed to Is 5- or greater are not estimated.
Major Historical Damaging Earthquakes in This Region
| Year | Region | M | Damage |
| 1933 | Off Noto Peninsula | 6.0 | 3 dead, 2 houses collapsed and 143 damaged. 2 injured in Toyama. |
| 1941 | Northern Nagano | 6.1 | 5 dead, 29 houses collapsed, 115 partially destroyed, 48 non-residential houses collapsed. |
| 1943 | Northern Nagano | 5.9 | 1 dead, 14 houses collapsed, 66 partially destroyed, 20 non-residential houses collapsed. |
| 1965 | Northern Nagano | 5.4 | Matsushiro Gunpatsu Earthquake,62,821 felt earthquakes until the late 1970s. There were 9 5-Is earthquakes, and 50 were 4-Is. Earthquakes causing damage led to 51. 15 injuries, 10 houses collapses, 4 partially destroyed houses, 60 landslides. |
| 1969 | Western And Central Mino, Gifu | 6.6 | 1 dead, 10 injured, 86 houses damaged. |
| 1984 | Southern Nagano | 6.8 | Naganoken Seibu Earthquake,29 dead, 10 injured. 14 house outflows or collapses, 73 partially destroyed, 565 damaged. 258 roads damaged. |
| 2011 | Border Between Nagano, Niigata | 6.7 | 57 injured, 73 houses collapsed, 427 partially destroyed (Nagano and Niigata; not including related death.). The maximum Is was 6+ in Sakae Village in Nagano. An Is of 6- was observed in Niigata. |
| 2011 | Central Nagano | 5.4 | 1 dead, 17 injured, 24 houses partially destroyed (Nagano). The maximum Is was 5+ (Matsumoto city in Nagano). |
| 2014 | Northern Nagano | 6.7 | The crustal earthquake with reverse faults, considered to have occurred in the northern part of Itoigawa-Shizuoka-kozosen fault zone. 77 houses collapsed and 137 partially destroyed (as of Jan. 5, 2015). The maximum Is was 6-. |
Reference: National Astronomical Observatory of Japan, Chronological Scientific Tables, Maruzen, (2017) *partially extracted
Seismic Hazard Information of J-SHIS
J-SHIS is a Web service by NIED, to help prevent and prepare for earthquake disaster by providing a public portal for seismic hazard information across Japan.