Updated: 2026-01-13 02:09:20 (UTC+9) Ver.5 Final Report

2026-01-13 01:58 (UTC+9),
SOUTHERN SOYA,
very shallow,
M 5.2
by JMA
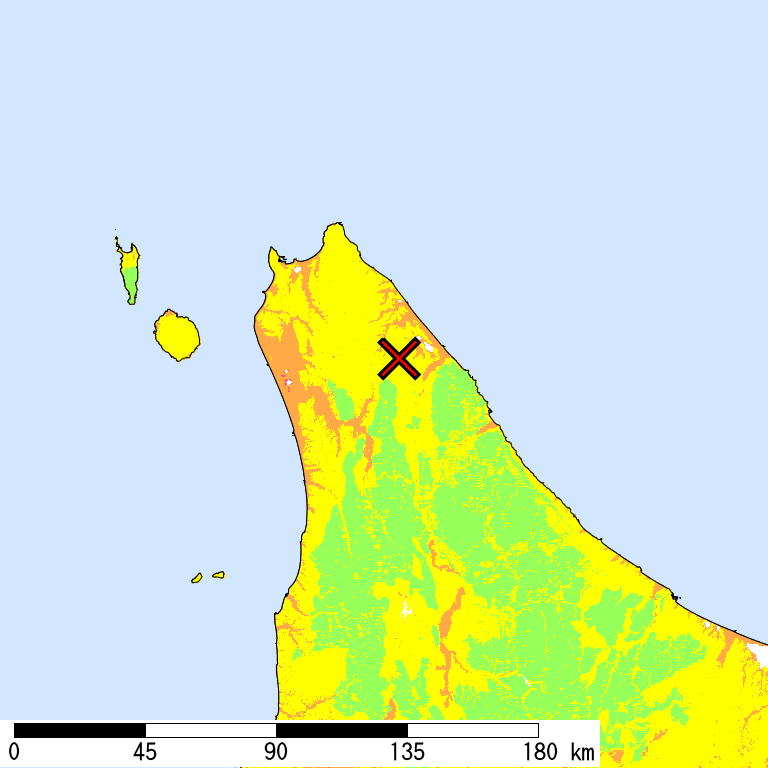
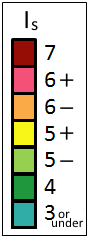
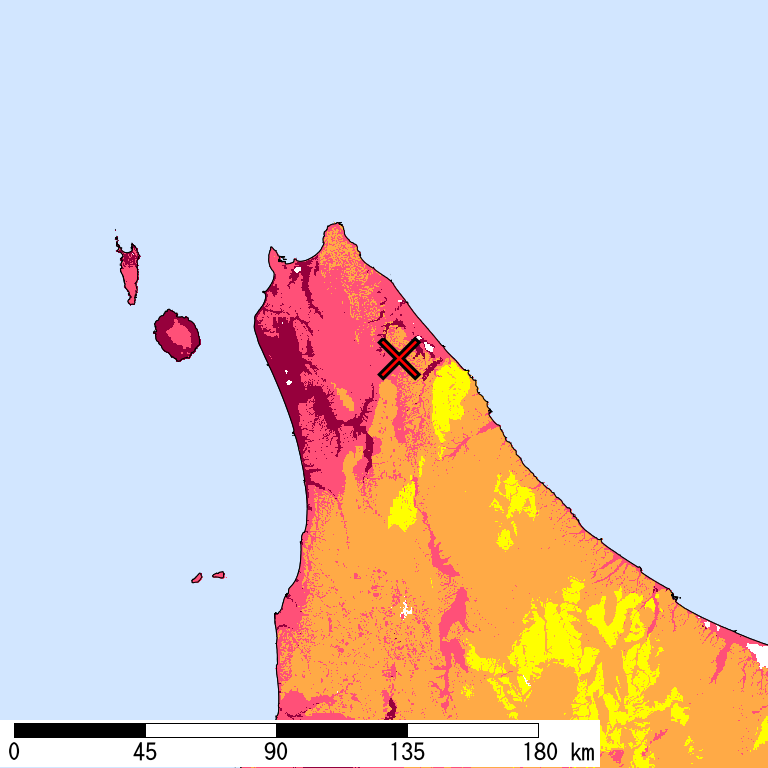
Is Distribution
Maximum Observed Is:6-
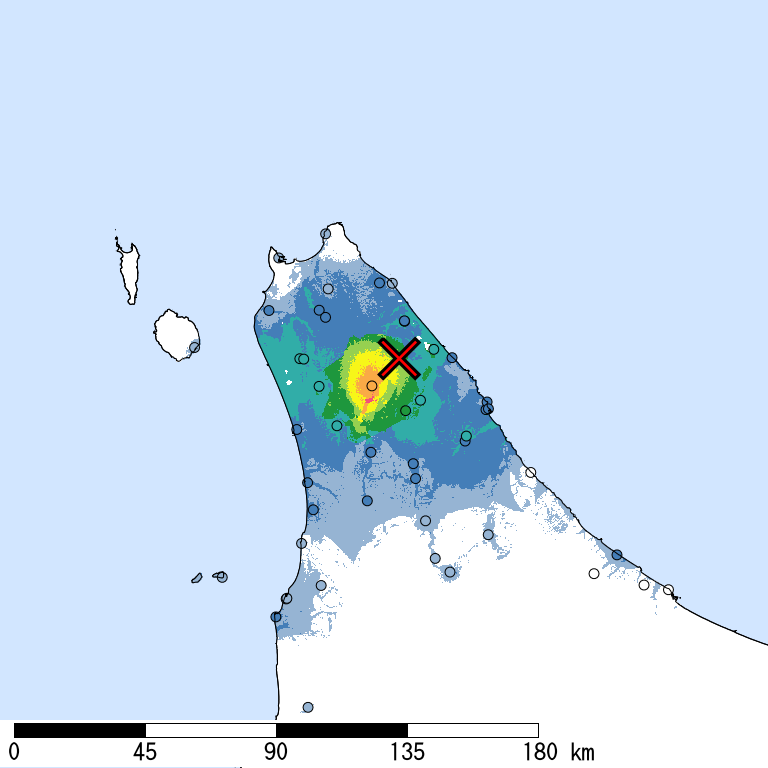
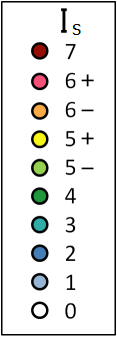
Seismic Intensity (Is) distribution is estimated from the observed data (circles) of NIED K-NET, KiK-net, JMA, and local governments that had been collected by 2026/01/13 02:09:12.
Estimated Is for Major Cities
| Max. Obs. Is | Histogram of Estimated Is |
Municipality Show All Data | Nighttime Population | Distance [km] |
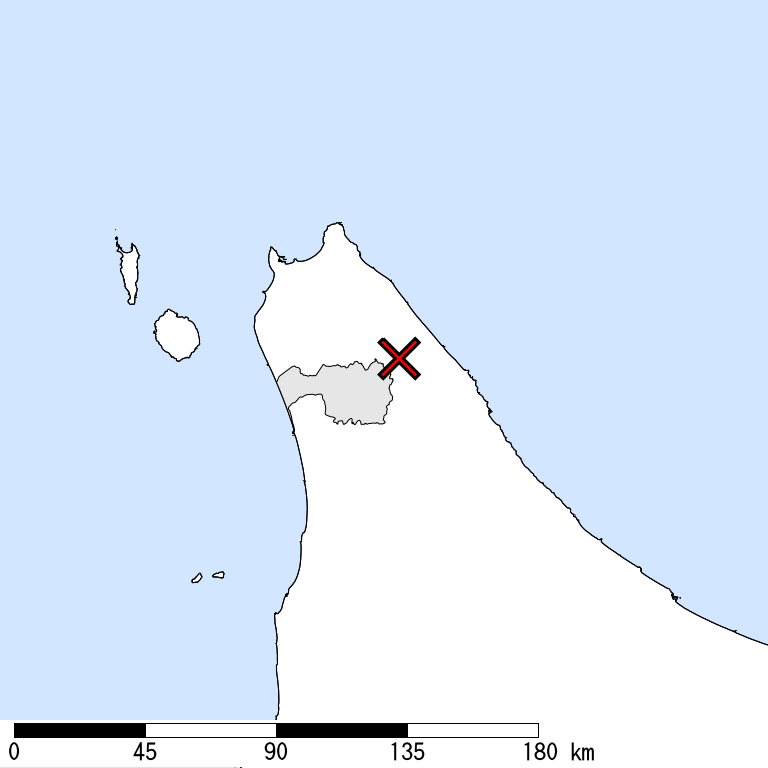
| 6- | Horonobe,Teshio,Hokkaido | 2,600 | 29 |
The histogram shows frequency distribution of estimated Is derived from interpolation of the observation with 250-m mesh. The daytime and nighttime correspond to 9:00-18:59 and 19:00-8:59, respectively. The distance is measured from the epicenter to the center of the municipality.
Is Exposed-Population Estimates of Each City
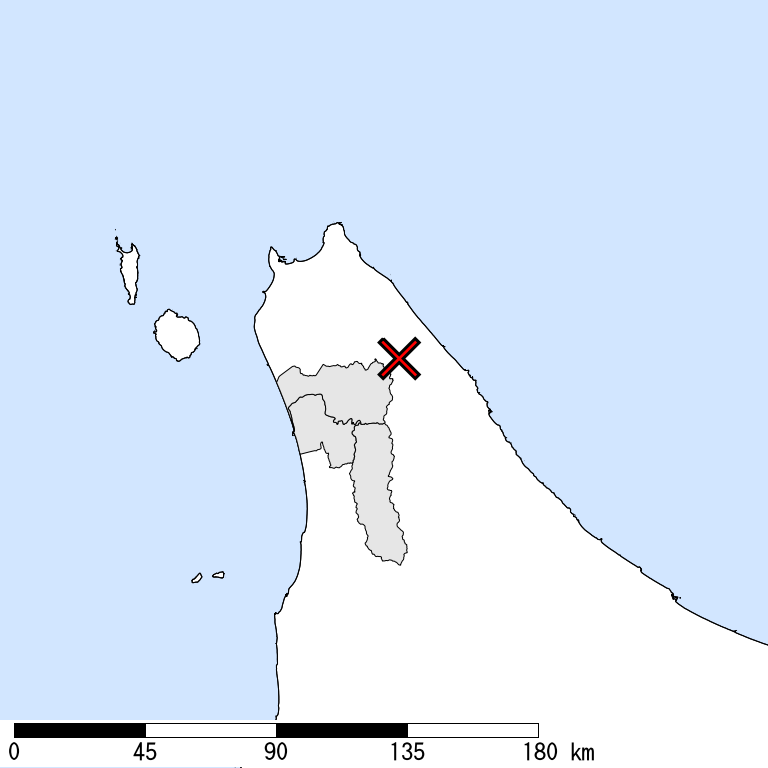
5- or greater
|
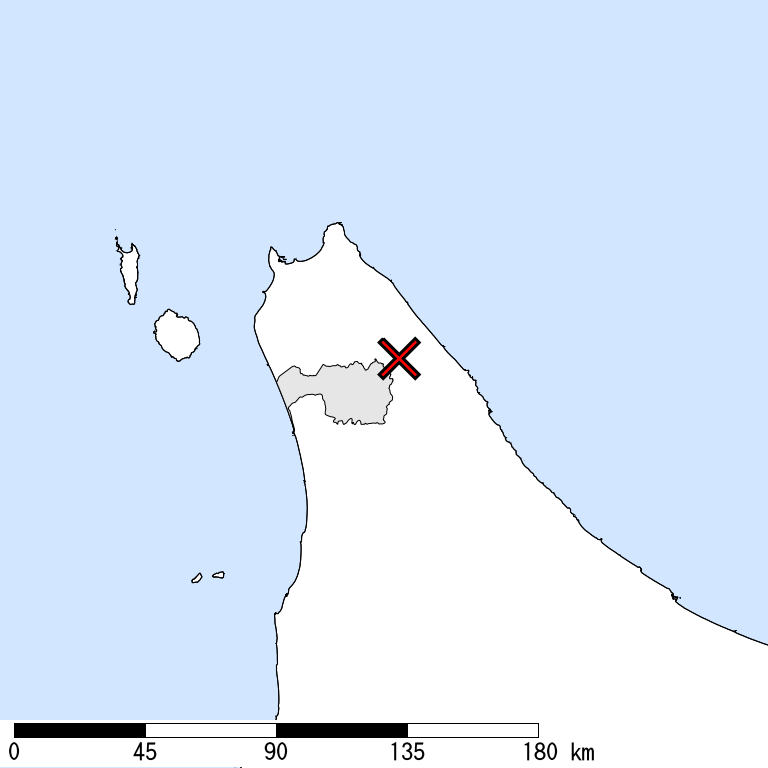
5+ or greater
|
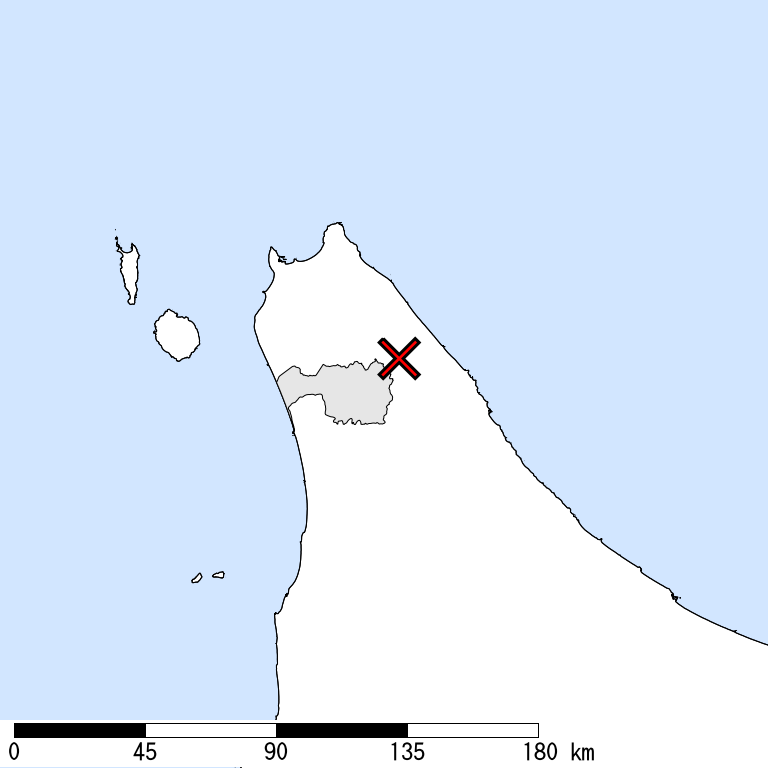
6- or greater
|
6+ or greater
|

| Show All Data | ||||
| 5- or greater |
5+ or greater |
6- or greater |
6+ or greater |
|
| Whole of Japan | < 1,000 | < 1,000 | < 1,000 | < 1,000 |
| Hokkaido Prefecture | < 1,000 | < 1,000 | < 1,000 | < 1,000 |
| Nakagawa,Nakagawa,Hokkaido | < 1,000 | |||
| Teshio,Teshio,Hokkaido | < 1,000 | |||
| Horonobe,Teshio,Hokkaido | < 1,000 | < 1,000 | < 1,000 | < 1,000 |
The summation of the exposed population for each city does not necessarily equal to that of the prefecture or whole of Japan.
Major Historical Damaging Earthquakes in This Region
No historical damaging earthquake is known in this region.
Seismic Hazard Information of J-SHIS
J-SHIS is a Web service by NIED, to help prevent and prepare for earthquake disaster by providing a public portal for seismic hazard information across Japan.