Updated: 2020-12-18 18:20:37 (UTC+9) Ver.2 Final Report
![]()
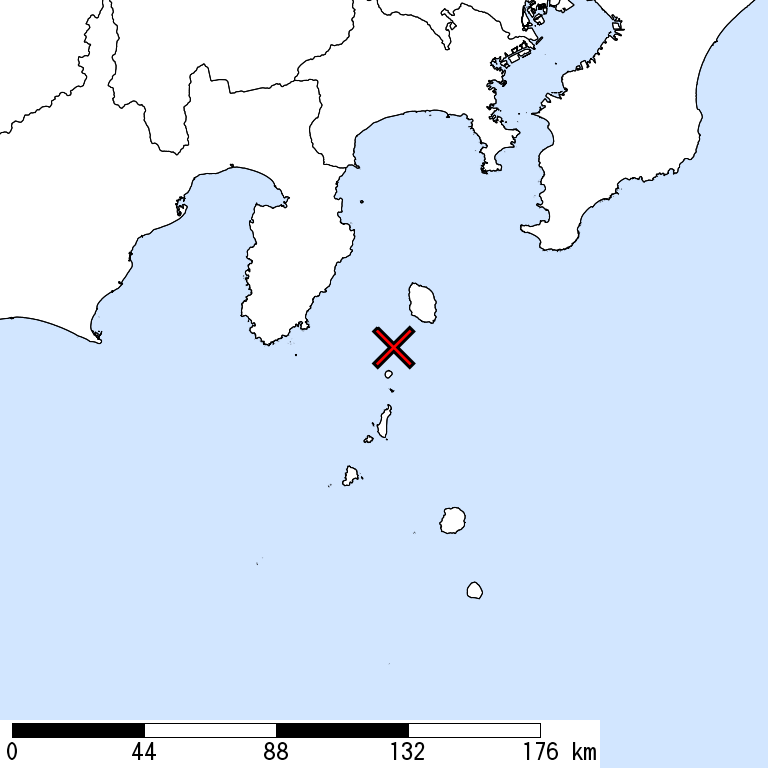
2020-12-18 18:09 (UTC+9),
NEAR IZU-OSHIMA ISLAND,
very shallow,
by JMA
Is Distribution
Maximum Observed Is:5-
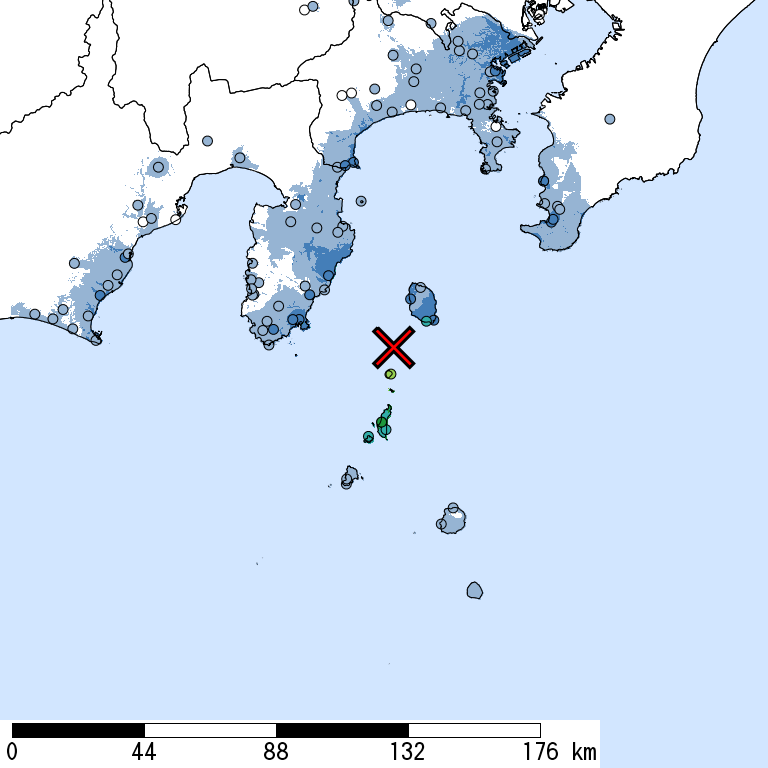
Seismic Intensity (Is) distribution is estimated from the observed data (circles) of NIED K-NET, KiK-net, JMA, and local governments that had been collected by 2020/12/18 18:20:13.
Estimated Is for Major Cities
| Max. Obs. Is | Histogram of Estimated Is |
Municipality Show All Data | Daytime Population | Distance [km] |
| 5- | Toshima-mura,Tokyo | 360 | 8 |
The histogram shows frequency distribution of estimated Is derived from interpolation of the observation with 250-m mesh. The daytime and nighttime correspond to 9:00-18:59 and 19:00-8:59, respectively. The distance is measured from the epicenter to the center of the municipality.
Is Exposed-Population Estimates of Each City

5- or greater
|

5+ or greater
Not Available
|
6- or greater
Not Available
|

6+ or greater
Not Available
|

| Show All Data | ||||
| 5- or greater |
5+ or greater |
6- or greater |
6+ or greater |
|
| Whole of Japan | < 1,000 | |||
| Tokyo Prefecture | < 1,000 | |||
| Toshima-mura,Tokyo | < 1,000 |
The summation of the exposed population for each city does not necessarily equal to that of the prefecture or whole of Japan.
Major Historical Damaging Earthquakes in This Region
| Year | Region | M | Damage |
| 1965 | Central Shizuoka | 6.1 | Shizuoka Earthquake,2 dead, 4 injured. 9 houses damaged. |
| 1967 | Near Niijima-Kozushima | 5.3 | 3 injured on Kozu Island. 7 houses collapsed, and 9 partially destroyed on Shikine Island. |
| 1968 | Near Niijima-Kozushima | 5.0 | 2 houses collapsed, 4 partially destroyed, 1 damaged, 4 roads damaged, 6 landslides on Shikine Island and Kozu Island. |
| 1974 | S Off Izu Peninsula | 6.9 | Izuhanto-oki Earthquake,30 dead, 102 injured, 134 houses collapsed, 240 partially collapsed, 5 collapsed by fire. |
| 1978 | Near Izu-Oshima Island | 7.0 | Izu Oshima Kinkai Earthquake,25 dead, 211 injured, 96 houses collapsed, 616 partially destroyed, 1,141 roads damaged, 191 landslides. |
| 1980 | E Off Izu Peninsula | 6.7 | 1 house collapsed, 17 partially damaged, 7 injured in Izu Peninsula. |
| 1983 | Eastern Yamanashi | 6.0 | Rockfalls in Tanzawa. 1 dead, 8 injured. 33 injured in Yamanashi, Kanagawa, Tokyo, and Sizuoka. 2 houses collapsed. |
| 2000 | Near Miyakejima Island | 6.5 | Swarm earthquakes led to an eruption on Miyake Island. 1 dead, 15 injured. 15 houses collapsed, 20 partially destroyed. |
| 2009 | Suruga Bay | 6.5 | 1 dead, 319 injured. 6 houses partially destroyed (as of March 2010). The maximum Is was 6- (4 cities in Shizuoka). A tsunami with a maximum height of 0.4 m in Omaezaki. |
Reference: National Astronomical Observatory of Japan, Chronological Scientific Tables, Maruzen, (2017) *partially extracted
Seismic Hazard Information of J-SHIS
J-SHIS is a Web service by NIED, to help prevent and prepare for earthquake disaster by providing a public portal for seismic hazard information across Japan.