Updated: 2016-07-27 23:53:50 (UTC+9) Ver.6

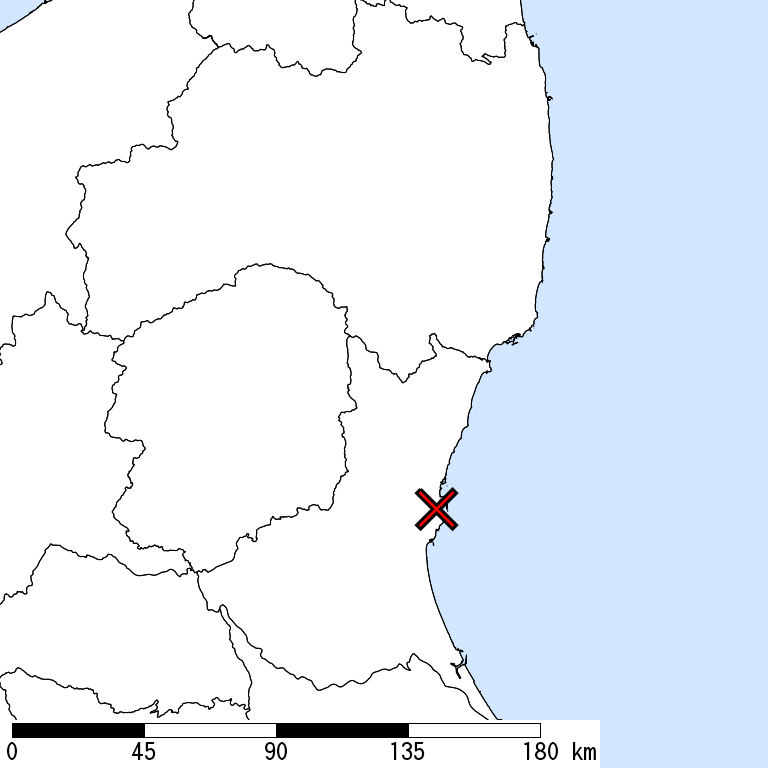
2016-07-27 23:47 (UTC+9),
NORTHERN IBARAKI,
50km Depth, M 5.3
by JMA
Is Distribution
Maximum Observed Is:5-
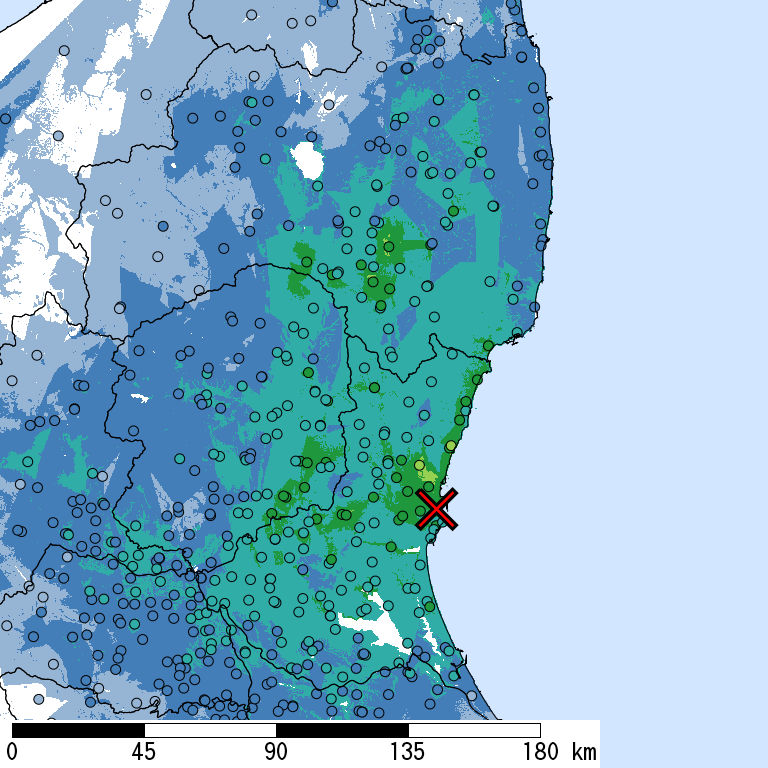
Seismic Intensity (Is) distribution is estimated from the observed data (circles) of NIED K-NET, KiK-net, JMA, and local governments that had been collected by 2016/07/27 23:53:28.
Estimated Is for Major Cities
| Max. Obs. Is | Histogram of Estimated Is |
Municipality Show All Data | Nighttime Population | Distance [km] |
| 5- | Hitachi,Ibaraki | 190,000 | 22 | |
| 5- | Hitachiota,Ibaraki | 56,000 | 16 | |
| 4 | Mito,Ibaraki | 270,000 | 12 | |
| 4 | Hitachinaka,Ibaraki | 160,000 | 5 | |
| 4 | Iwaki,Fukushima | 340,000 | 76 | |
| 3 | Chikusei,Ibaraki | 110,000 | 56 | |
| 3 | Tsuchiura,Ibaraki | 140,000 | 51 | |
| 3 | Ashikaga,Tochigi | 150,000 | 103 | |
| 3 | Tsukuba,Ibaraki | 210,000 | 62 | |
| 3 | Kanuma,Tochigi | 100,000 | 78 | |
| 3 | Kasukabe,Saitama | 240,000 | 89 | |
| 3 | Oyama,Tochigi | 160,000 | 72 | |
| 3 | Koriyama,Fukushima | 340,000 | 113 | |
| 3 | Kiryu,Gumma | 120,000 | 113 | |
| 3 | Utsunomiya,Tochigi | 510,000 | 66 | |
| 3 | Noda,Chiba | 150,000 | 81 | |
| 3 | Kuki,Saitama | 150,000 | 91 | |
| 3 | Ota,Gumma | 220,000 | 110 | |
| 3 | Isesaki,Gumma | 210,000 | 126 | |
| 3 | Kumagaya,Saitama | 200,000 | 112 |
The histogram shows frequency distribution of estimated Is derived from interpolation of the observation with 250-m mesh. The daytime and nighttime correspond to 9:00-18:59 and 19:00-8:59, respectively. The distance is measured from the epicenter to the center of the municipality.
Is Exposed-Population Estimates of Each City
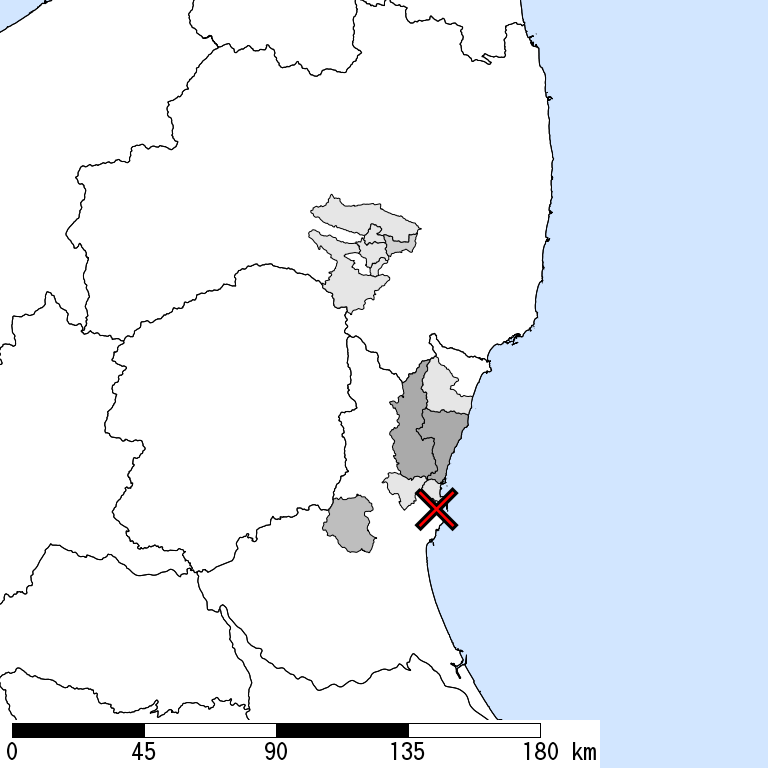
5- or greater
|
5+ or greater
Not Available
|

6- or greater
Not Available
|

6+ or greater
Not Available
|

| Show All Data | ||||
| 5- or greater |
5+ or greater |
6- or greater |
6+ or greater |
|
| Whole of Japan | 20,000 | |||
| Fukushima Prefecture | 2,000 | |||
| Shirakawa,Fukushima | < 1,000 | |||
| Sukagawa,Fukushima | < 1,000 | |||
| Kagamiishi,Iwase,Fukushima | < 1,000 | |||
| Nakajima,Nishishirakawa,Fukushima | < 1,000 | |||
| Yabuki,Nishishirakawa,Fukushima | < 1,000 | |||
| Tamakawa,Ishikawa,Fukushima | 1,000 | |||
| Ibaraki Prefecture | 20,000 | |||
| Hitachi,Ibaraki | 10,000 | |||
| Hitachiota,Ibaraki | 10,000 | |||
| Takahagi,Ibaraki | < 1,000 | |||
| Kasama,Ibaraki | 2,000 | |||
| Naka,Ibaraki | < 1,000 | |||
| Tokai,Naka,Ibaraki | < 1,000 |
The summation of the exposed population for each city does not necessarily equal to that of the prefecture or whole of Japan.
Major Historical Damaging Earthquakes in This Region
| Year | Region | M | Damage |
| 1895 | Southern Ibaraki | 7.2 | 53 collapses (43 houses and 10 depots), 6 dead. |
| 1915 | Boso Peninsula | 6.0 | Some landslides. 5 injured, some houses collapsed. |
| 1921 | Southern Ibaraki | 7.0 | Ryugasaki Earthquake,Minor damage in Chiba and Ibaraki such as damage to houses and roads. |
| 1938 | Off Ibaraki | 7.0 | 250 houses damaged in Fukushima. 1 depot collapsed in Ibaraki. A small tsunami was observed. |
| 1943 | Aizu, Fukushima | 6.2 | Tajima Earthquake,Minor damage such as landslides and spalling of walls. |
| 1949 | Northern Tochigi | 6.2 | Imaichi Earthquake,10 dead, 290 houses collapsed, 2,994 partially destroyed, 618 non-residential houses collapsed. Many masonries were damaged. Many landslides were observed. |
| 1987 | E Off Chiba | 6.7 | 2 dead, 161 injured in Chiba. 16 houses collapsed and over 70,000 partially destroyed. Many roads damaged. |
| 2011 | Hamadori, Fukushima | 7.0 | The crustal earthquake with normal faults, induced by the 2011 Off the Pacific Coast of Tohoku Earthquake. 4 dead, 10 injured (as of March 2012). Maximum Is was 6-. |
| 2012 | E Off Chiba | 6.1 | The crustal earthquake with normal faults, induced by the 2011 Off the Pacific Coast of Tohoku Earthquake. 1 dead, 1 injured. Maximum Is was 5+. |
Reference: National Astronomical Observatory of Japan, "Rika Nenpyo Web Edition", MARUZEN *partially extracted
Seismic Hazard Information of J-SHIS
J-SHIS is a Web service by NIED, to help prevent and prepare for earthquake disaster by providing a public portal for seismic hazard information across Japan.