

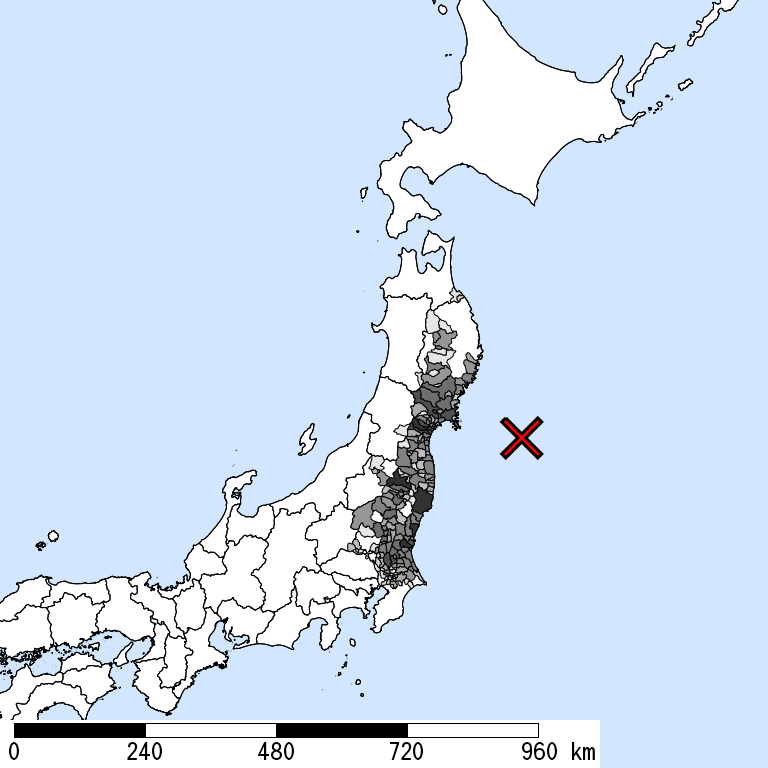
2011-03-11 14:46:18 (UTC+9),
OFF SANRIKU,
24km Depth, M 9.0
by JMA
Is Distribution
Maximum Observed Is:7
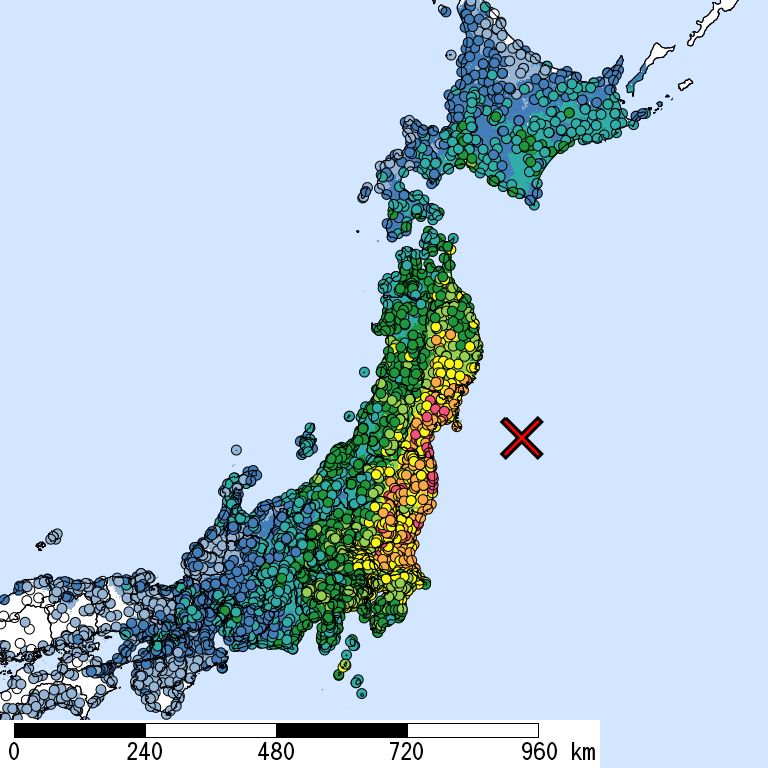
Seismic Intensity (Is) distribution is estimated from the observed data (circles) of NIED K-NET, KiK-net, JMA, and local governments that had been collected by 2016/11.
Estimated Is for Major Cities
| Max. Obs. Is | Histogram of Estimated Is 1
2
3
4
5-
5+
6-
6+
7
|
Municipality Show All Data | Daytime Population | Distance [km] |
| 7 |
|
Kurihara,Miyagi | 77,000 | 174 |
| 7 |
|
Haga,Haga,Tochigi | 30,000 | 302 |
| 6+ |
|
Hitachi,Ibaraki | 210,000 | 257 |
| 6+ |
|
Hokota,Ibaraki | 47,000 | 299 |
| 6+ |
|
Ishinomaki,Miyagi | 170,000 | 140 |
| 6+ |
|
Motegi,Haga,Tochigi | 14,000 | 293 |
| 6+ |
|
Okuma,Futaba,Fukushima | 14,000 | 182 |
| 6+ |
|
Kunimi,Date,Fukushima | 8,800 | 203 |
| 6+ |
|
Miyagino,Sendai,Miyagi | 200,000 | 171 |
| 6+ |
|
Osaki,Miyagi | 130,000 | 173 |
| 6+ |
|
Tome,Miyagi | 86,000 | 159 |
| 6+ |
|
Naka,Ibaraki | 47,000 | 278 |
| 6+ |
|
Sakuragawa,Ibaraki | 42,000 | 314 |
| 6+ |
|
Namie,Futaba,Fukushima | 19,000 | 176 |
| 6+ |
|
Kawasaki,Shibata,Miyagi | 9,200 | 193 |
| 6+ |
|
Tenei,Iwase,Fukushima | 5,100 | 248 |
| 6+ |
|
Nikko,Tochigi | 87,000 | 318 |
| 6+ |
|
Otawara,Tochigi | 79,000 | 285 |
| 6+ |
|
Kasama,Ibaraki | 71,000 | 300 |
| 6+ |
|
Natori,Miyagi | 67,000 | 172 |
| 6+ |
|
Shirakawa,Fukushima | 64,000 | 257 |
| 6+ |
|
Omitama,Ibaraki | 49,000 | 303 |
| 6+ |
|
Higashimatsushima,Miyagi | 36,000 | 148 |
| 6+ |
|
Takanezawa,Shioya,Tochigi | 24,000 | 302 |
| 6+ |
|
Misato,Toda,Miyagi | 23,000 | 164 |
| 6+ |
|
Nakagawa,Nasu,Tochigi | 17,000 | 281 |
| 6+ |
|
Ichikai,Haga,Tochigi | 10,000 | 299 |
| 6+ |
|
Shinchi,Soma,Fukushima | 7,700 | 171 |
| 6+ |
|
Futaba,Futaba,Fukushima | 6,800 | 177 |
| 6+ |
|
Utsunomiya,Tochigi | 510,000 | 314 |
| 6+ |
|
Chikusei,Ibaraki | 100,000 | 323 |
| 6+ |
|
Sukagawa,Fukushima | 73,000 | 236 |
| 6+ |
|
Shiogama,Miyagi | 51,000 | 162 |
| 6+ |
|
Hitachiomiya,Ibaraki | 43,000 | 277 |
| 6+ |
|
Takahagi,Ibaraki | 29,000 | 244 |
| 6+ |
|
Nishigo,Nishishirakawa,Fukushima | 19,000 | 261 |
| 6+ |
|
Wakuya,Toda,Miyagi | 17,000 | 158 |
| 6+ |
|
Miharu,Tamura,Fukushima | 16,000 | 220 |
| 6+ |
|
Tomioka,Futaba,Fukushima | 16,000 | 183 |
| 6+ |
|
Yamamoto,Watari,Miyagi | 14,000 | 174 |
| 6+ |
|
Ninomiya,Haga,Tochigi | 13,000 | 319 |
| 6+ |
|
Zao,Katta,Miyagi | 13,000 | 192 |
| 6+ |
|
Kagamiishi,Iwase,Fukushima | 13,000 | 240 |
| 6+ |
|
Naraha,Futaba,Fukushima | 8,300 | 187 |
| 6+ |
|
Ohira,Kurokawa,Miyagi | 8,000 | 177 |
| 6- |
|
Koriyama,Fukushima | 350,000 | 233 |
| 6- |
|
Tsukuba,Ibaraki | 210,000 | 337 |
| 6- |
|
Kitakami,Iwate | 100,000 | 200 |
| 6- |
|
Hitachiota,Ibaraki | 49,000 | 269 |
| 6- |
|
Iwanuma,Miyagi | 41,000 | 173 |
| 6- |
|
Tamura,Fukushima | 38,000 | 214 |
| 6- |
|
Shirosato,Higashiibaraki,Ibaraki | 17,000 | 284 |
| 6- |
|
Hirono,Futaba,Fukushima | 5,300 | 191 |
| 6- |
|
Katsurao,Futaba,Fukushima | 1,400 | 195 |
| 6- |
|
Iwaki,Fukushima | 340,000 | 209 |
| 6- |
|
Mito,Ibaraki | 300,000 | 286 |
| 6- |
|
Izumi,Sendai,Miyagi | 170,000 | 174 |
| 6- |
|
Tsuchiura,Ibaraki | 150,000 | 326 |
| 6- |
|
Hitachinaka,Ibaraki | 150,000 | 280 |
| 6- |
|
Wakabayashi,Sendai,Miyagi | 130,000 | 171 |
| 6- |
|
Ichinoseki,Iwate | 120,000 | 176 |
| 6- |
|
Kesennuma,Miyagi | 67,000 | 143 |
| 6- |
|
Nihommatsu,Fukushima | 59,000 | 220 |
| 6- |
|
Inashiki,Ibaraki | 43,000 | 328 |
| 6- |
|
Soma,Fukushima | 37,000 | 173 |
| 6- |
|
Namegata,Ibaraki | 36,000 | 315 |
| 6- |
|
Kakuda,Miyagi | 33,000 | 182 |
| 6- |
|
Nasu,Nasu,Tochigi | 27,000 | 269 |
| 6- |
|
Yabuki,Nishishirakawa,Fukushima | 18,000 | 243 |
| 6- |
|
Nakajima,Nishishirakawa,Fukushima | 4,400 | 245 |
| 6- |
|
Kawauchi,Futaba,Fukushima | 3,000 | 199 |
| 6- |
|
Aoba,Sendai,Miyagi | 410,000 | 174 |
| 6- |
|
Aizuwakamatsu,Fukushima | 140,000 | 266 |
| 6- |
|
Toride,Ibaraki | 92,000 | 348 |
| 6- |
|
Minamisoma,Fukushima | 68,000 | 174 |
| 6- |
|
Moka,Tochigi | 67,000 | 312 |
| 6- |
|
Kamaishi,Iwate | 44,000 | 155 |
| 6- |
|
Kitaibaraki,Ibaraki | 44,000 | 235 |
| 6- |
|
Tokai,Naka,Ibaraki | 36,000 | 272 |
| 6- |
|
Ibaraki,Higashiibaraki,Ibaraki | 30,000 | 295 |
| 6- |
|
Yahaba,Shiwa,Iwate | 28,000 | 223 |
| 6- |
|
Daigo,Kuji,Ibaraki | 20,000 | 266 |
| 6- |
|
Miho,Inashiki,Ibaraki | 16,000 | 325 |
| 6- |
|
Matsushima,Miyagi,Miyagi | 14,000 | 159 |
| 6- |
|
Kori,Date,Fukushima | 12,000 | 207 |
| 6- |
|
Narita,Chiba | 140,000 | 343 |
| 6- |
|
Ishioka,Ibaraki | 74,000 | 311 |
| 6- |
|
Kashima,Ibaraki | 62,000 | 308 |
| 6- |
|
Date,Fukushima | 62,000 | 203 |
| 6- |
|
Takizawa,Iwate,Iwate | 47,000 | 237 |
| 6- |
|
Ofunato,Iwate | 44,000 | 147 |
| 6- |
|
Shiroi,Chiba | 42,000 | 358 |
| 6- |
|
Shiroishi,Miyagi | 37,000 | 196 |
| 6- |
|
Nasukarasuyama,Tochigi | 29,000 | 288 |
| 6- |
|
Rifu,Miyagi,Miyagi | 27,000 | 166 |
| 6- |
|
Itako,Ibaraki | 25,000 | 315 |
| 6- |
|
Ogawara,Shibata,Miyagi | 23,000 | 186 |
| 6- |
|
Minamisanriku,Motoyoshi,Miyagi | 18,000 | 138 |
| 6- |
|
Ono,Tamura,Fukushima | 11,000 | 216 |
| 6- |
|
Osato,Kurokawa,Miyagi | 9,000 | 165 |
| 6- |
|
Fujisawa,Higashiiwai,Iwate | 8,800 | 155 |
| 6- |
|
Hirata,Ishikawa,Fukushima | 6,200 | 224 |
| 6- |
|
Asakawa,Ishikawa,Fukushima | 5,800 | 243 |
| 6- |
|
Morioka,Iwate | 320,000 | 230 |
| 6- |
|
Fukushima,Fukushima | 300,000 | 212 |
| 6- |
|
Sakura,Chiba | 130,000 | 353 |
| 6- |
|
Oshu,Iwate | 120,000 | 188 |
| 6- |
|
Kiryu,Gumma | 120,000 | 364 |
| 6- |
|
Nasushiobara,Tochigi | 110,000 | 278 |
| 6- |
|
Hanamaki,Iwate | 100,000 | 207 |
| 6- |
|
Joso,Ibaraki | 66,000 | 343 |
| 6- |
|
Bando,Ibaraki | 51,000 | 348 |
| 6- |
|
Inzai,Chiba | 47,000 | 349 |
| 6- |
|
Shimotsuma,Ibaraki | 44,000 | 333 |
| 6- |
|
Sakura,Tochigi | 37,000 | 300 |
| 6- |
|
Kasumigaura,Ibaraki | 37,000 | 318 |
| 6- |
|
Tsukubamirai,Ibaraki | 35,000 | 345 |
| 6- |
|
Tomiya,Kurokawa,Miyagi | 31,000 | 174 |
| 6- |
|
Motomiya,Fukushima | 30,000 | 226 |
| 6- |
|
Miyashiro,Minamisaitama,Saitama | 29,000 | 362 |
| 6- |
|
Watari,Watari,Miyagi | 28,000 | 175 |
| 6- |
|
Taiwa,Kurokawa,Miyagi | 27,000 | 176 |
| 6- |
|
Tanagura,Higashishirakawa,Fukushima | 16,000 | 249 |
| 6- |
|
Kawamata,Date,Fukushima | 16,000 | 204 |
| 6- |
|
Inawashiro,Yama,Fukushima | 16,000 | 249 |
| 6- |
|
Tamakawa,Ishikawa,Fukushima | 7,000 | 237 |
| 6- |
|
Motono,Inba,Chiba | 5,800 | 347 |
| 6- |
|
Iitate,Soma,Fukushima | 5,700 | 192 |
| 5+ |
|
Kumagaya,Saitama | 200,000 | 376 |
| 5+ |
|
Kasukabe,Saitama | 180,000 | 363 |
| 5+ |
|
Asahi,Yokohama,Kanagawa | 170,000 | 415 |
| 5+ |
|
Taihaku,Sendai,Miyagi | 160,000 | 173 |
| 5+ |
|
Oyama,Tochigi | 160,000 | 336 |
| 5+ |
|
Katori,Chiba | 77,000 | 322 |
| 5+ |
|
Shibata,Shibata,Miyagi | 37,000 | 183 |
| 5+ |
|
Ora,Ora,Gumma | 27,000 | 363 |
| 5+ |
|
Kami,Kami,Miyagi | 26,000 | 182 |
| 5+ |
|
Rikuzentakata,Iwate | 22,000 | 147 |
| 5+ |
|
Aizumisato,Onuma,Fukushima | 20,000 | 274 |
| 5+ |
|
Mashiko,Haga,Tochigi | 20,000 | 305 |
| 5+ |
|
Otone,Kitasaitama,Saitama | 15,000 | 357 |
| 5+ |
|
Marumori,Igu,Miyagi | 14,000 | 184 |
| 5+ |
|
Shichigahama,Miyagi,Miyagi | 13,000 | 158 |
| 5+ |
|
Murata,Shibata,Miyagi | 12,000 | 186 |
| 5+ |
|
Iwaizumi,Shimohei,Iwate | 12,000 | 213 |
| 5+ |
|
Hashikami,Sannohe,Aomori | 11,000 | 281 |
| 5+ |
|
Kawachi,Inashiki,Ibaraki | 8,500 | 338 |
| 5+ |
|
Shikama,Kami,Miyagi | 7,000 | 181 |
| 5+ |
|
Sumita,Kesen,Iwate | 6,300 | 160 |
| 5+ |
|
Yugawa,Kawanuma,Fukushima | 3,100 | 267 |
| 5+ |
|
Arakawa,Tokyo | 170,000 | 379 |
| 5+ |
|
Noda,Chiba | 130,000 | 356 |
| 5+ |
|
Kamisu,Ibaraki | 94,000 | 314 |
| 5+ |
|
Asahi,Chiba | 65,000 | 330 |
| 5+ |
|
Tagajo,Miyagi | 57,000 | 163 |
| 5+ |
|
Yuki,Ibaraki | 48,000 | 331 |
| 5+ |
|
Ami,Inashiki,Ibaraki | 43,000 | 329 |
| 5+ |
|
Ninohe,Iwate | 31,000 | 275 |
| 5+ |
|
Tono,Iwate | 30,000 | 177 |
| 5+ |
|
Yoshimi,Hiki,Saitama | 19,000 | 379 |
| 5+ |
|
Aizubange,Kawanuma,Fukushima | 17,000 | 273 |
| 5+ |
|
Oshino,Minamitsuru,Yamanashi | 9,500 | 462 |
| 5+ |
|
Hiraizumi,Nishiiwai,Iwate | 8,100 | 180 |
| 5+ |
|
Izumizaki,Nishishirakawa,Fukushima | 7,300 | 249 |
| 5+ |
|
Otama,Adachi,Fukushima | 7,000 | 227 |
| 5+ |
|
Furudono,Ishikawa,Fukushima | 5,800 | 232 |
| 5+ |
|
Fudai,Shimohei,Iwate | 3,000 | 227 |
| 5+ |
|
Naka,Yokohama,Kanagawa | 250,000 | 411 |
| 5+ |
|
Hachinohe,Aomori | 240,000 | 292 |
| 5+ |
|
Chuo,Chiba,Chiba | 230,000 | 369 |
| 5+ |
|
Odawara,Kanagawa | 190,000 | 457 |
| 5+ |
|
Mihama,Chiba,Chiba | 150,000 | 370 |
| 5+ |
|
Koga,Ibaraki | 130,000 | 348 |
| 5+ |
|
Hanamigawa,Chiba,Chiba | 120,000 | 367 |
| 5+ |
|
Kanuma,Tochigi | 97,000 | 324 |
| 5+ |
|
Konosu,Saitama | 92,000 | 372 |
| 5+ |
|
Ryugasaki,Ibaraki | 70,000 | 340 |
| 5+ |
|
Kuki,Saitama | 64,000 | 363 |
| 5+ |
|
Kazo,Saitama | 58,000 | 362 |
| 5+ |
|
Hanyu,Saitama | 51,000 | 363 |
| 5+ |
|
Shimotsuke,Tochigi | 50,000 | 328 |
| 5+ |
|
Oizumi,Ora,Gumma | 49,000 | 369 |
| 5+ |
|
Samukawa,Koza,Kanagawa | 43,000 | 433 |
| 5+ |
|
Yaita,Tochigi | 35,000 | 296 |
| 5+ |
|
Hachimantai,Iwate | 29,000 | 253 |
| 5+ |
|
Sakai,Sashima,Ibaraki | 26,000 | 350 |
| 5+ |
|
Oirase,Kamikita,Aomori | 21,000 | 304 |
| 5+ |
|
Ninomiya,Naka,Kanagawa | 21,000 | 447 |
| 5+ |
|
Kurihashi,Kitakatsushika,Saitama | 20,000 | 356 |
| 5+ |
|
Kanegasaki,Isawa,Iwate | 20,000 | 193 |
| 5+ |
|
Tohoku,Kamikita,Aomori | 18,000 | 322 |
| 5+ |
|
Yamada,Shimohei,Iwate | 18,000 | 170 |
| 5+ |
|
Kisai,Kitasaitama,Saitama | 17,000 | 366 |
| 5+ |
|
Inba,Inba,Chiba | 12,000 | 350 |
| 5+ |
|
Goka,Sashima,Ibaraki | 12,000 | 353 |
| 5+ |
|
Meiwa,Ora,Gumma | 11,000 | 362 |
| 5+ |
|
Nakayama,Higashimurayama,Yamagata | 9,000 | 226 |
| 5+ |
|
Yamatsuri,Higashishirakawa,Fukushima | 6,400 | 254 |
| 5+ |
|
Bandai,Yama,Fukushima | 4,200 | 259 |
| 5+ |
|
Higashinaruse,Ogachi,Akita | 2,500 | 225 |
| 5+ |
|
Koto,Tokyo | 470,000 | 382 |
| 5+ |
|
Chiyoda,Tokyo | 1,000,000 | 384 |
| 5+ |
|
Adachi,Tokyo | 500,000 | 375 |
| 5+ |
|
Itabashi,Tokyo | 430,000 | 383 |
| 5+ |
|
Akita,Akita | 340,000 | 298 |
| 5+ |
|
Nakano,Tokyo | 250,000 | 389 |
| 5+ |
|
Kawasaki,Kawasaki,Kanagawa | 230,000 | 401 |
| 5+ |
|
Kanagawa,Yokohama,Kanagawa | 230,000 | 410 |
| 5+ |
|
Soka,Saitama | 180,000 | 371 |
| 5+ |
|
Nishi,Yokohama,Kanagawa | 180,000 | 412 |
| 5+ |
|
Chofu,Tokyo | 170,000 | 401 |
| 5+ |
|
Omiya,Saitama,Saitama | 160,000 | 376 |
| 5+ |
|
Ashikaga,Tochigi | 150,000 | 360 |
| 5+ |
|
Yachiyo,Chiba | 150,000 | 361 |
| 5+ |
|
Urayasu,Chiba | 150,000 | 378 |
| 5+ |
|
Fukaya,Saitama | 130,000 | 381 |
| 5+ |
|
Wakaba,Chiba,Chiba | 110,000 | 365 |
| 5+ |
|
Toda,Saitama | 110,000 | 380 |
| 5+ |
|
Yonezawa,Yamagata | 100,000 | 240 |
| 5+ |
|
Daisen,Akita | 93,000 | 255 |
| 5+ |
|
Shibukawa,Gumma | 83,000 | 385 |
| 5+ |
|
Gyoda,Saitama | 77,000 | 372 |
| 5+ |
|
Togane,Chiba | 59,000 | 359 |
| 5+ |
|
Kitakata,Fukushima | 53,000 | 266 |
| 5+ |
|
Numata,Gumma | 52,000 | 374 |
| 5+ |
|
Yoshikawa,Saitama | 45,000 | 363 |
| 5+ |
|
Shiraoka,Minamisaitama,Saitama | 34,000 | 365 |
| 5+ |
|
Chuo,Yamanashi | 31,000 | 476 |
| 5+ |
|
Yachiyo,Yuki,Ibaraki | 21,000 | 339 |
| 5+ |
|
Ishikawa,Ishikawa,Fukushima | 18,000 | 237 |
| 5+ |
|
Oarai,Higashiibaraki,Ibaraki | 18,000 | 284 |
| 5+ |
|
Tako,Katori,Chiba | 16,000 | 338 |
| 5+ |
|
Sakae,Imba,Chiba | 16,000 | 342 |
| 5+ |
|
Chiyoda,Ora,Gumma | 12,000 | 368 |
| 5+ |
|
Kitakawabe,Kitasaitama,Saitama | 9,600 | 354 |
| 5+ |
|
Higashidori,Shimokita,Aomori | 7,200 | 376 |
| 5+ |
|
Kozaki,Katori,Chiba | 5,600 | 327 |
| 5+ |
|
Niijima,Tokyo | 3,400 | 525 |
| 5+ |
|
Shingo,Sannohe,Aomori | 2,900 | 299 |
| 5+ |
|
Edogawa,Tokyo | 460,000 | 376 |
| 5+ |
|
Suginami,Tokyo | 380,000 | 391 |
| 5+ |
|
Kawaguchi,Saitama | 380,000 | 377 |
| 5+ |
|
Machida,Tokyo | 360,000 | 415 |
| 5+ |
|
Takasaki,Gumma | 350,000 | 394 |
| 5+ |
|
Matsudo,Chiba | 340,000 | 367 |
| 5+ |
|
Kashiwa,Chiba | 310,000 | 356 |
| 5+ |
|
Kohoku,Yokohama,Kanagawa | 270,000 | 406 |
| 5+ |
|
Sumida,Tokyo | 260,000 | 380 |
| 5+ |
|
Ota,Gumma | 230,000 | 368 |
| 5+ |
|
Narashino,Chiba | 130,000 | 368 |
| 5+ |
|
Sano,Tochigi | 120,000 | 352 |
| 5+ |
|
Kisarazu,Chiba | 110,000 | 401 |
| 5+ |
|
Iwatsuki,Saitama,Saitama | 100,000 | 368 |
| 5+ |
|
Misato,Saitama | 94,000 | 366 |
| 5+ |
|
Chuo,Saitama,Saitama | 87,000 | 378 |
| 5+ |
|
Higashimatsuyama,Saitama | 87,000 | 383 |
| 5+ |
|
Choshi,Chiba | 75,000 | 319 |
| 5+ |
|
Ushiku,Ibaraki | 62,000 | 337 |
| 5+ |
|
Miyako,Iwate | 60,000 | 187 |
| 5+ |
|
Sammu,Chiba | 49,000 | 353 |
| 5+ |
|
Moriya,Ibaraki | 43,000 | 350 |
| 5+ |
|
Satte,Saitama | 42,000 | 357 |
| 5+ |
|
Sosa,Chiba | 39,000 | 335 |
| 5+ |
|
Sugito,Kitakatsushika,Saitama | 38,000 | 360 |
| 5+ |
|
Kaminokawa,Kawachi,Tochigi | 33,000 | 319 |
| 5+ |
|
Kaminoyama,Yamagata | 32,000 | 226 |
| 5+ |
|
Washimiya,Kitakatsushika,Saitama | 24,000 | 360 |
| 5+ |
|
Takahata,Higashiokitama,Yamagata | 23,000 | 233 |
| 5+ |
|
Obanazawa,Yamagata | 20,000 | 220 |
| 5+ |
|
Kawajima,Hiki,Saitama | 19,000 | 381 |
| 5+ |
|
Gonohe,Sannohe,Aomori | 18,000 | 300 |
| 5+ |
|
Iwafune,Shimotsuga,Tochigi | 17,000 | 346 |
| 5+ |
|
Fujimi,Seta,Gumma | 15,000 | 381 |
| 5+ |
|
Fujioka,Shimotsuga,Tochigi | 15,000 | 350 |
| 5+ |
|
Motoyoshi,Motoyoshi,Miyagi | 10,000 | 140 |
| 5+ |
|
Shirako,Chosei,Chiba | 10,000 | 368 |
| 5+ |
|
Kyonan,Awa,Chiba | 8,200 | 428 |
| 5+ |
|
Kunohe,Kunohe,Iwate | 6,200 | 264 |
| 5+ |
|
Shichikashuku,Katta,Miyagi | 1,900 | 211 |
| 5- |
|
Minato,Tokyo | 990,000 | 387 |
| 5- |
|
Chuo,Tokyo | 760,000 | 385 |
| 5- |
|
Setagaya,Tokyo | 620,000 | 395 |
| 5- |
|
Ota,Tokyo | 590,000 | 397 |
| 5- |
|
Nerima,Tokyo | 460,000 | 388 |
| 5- |
|
Bunkyo,Tokyo | 370,000 | 383 |
| 5- |
|
Maebashi,Gumma | 330,000 | 386 |
| 5- |
|
Katsushika,Tokyo | 320,000 | 375 |
| 5- |
|
Ichikawa,Chiba | 320,000 | 371 |
| 5- |
|
Atsugi,Kanagawa | 250,000 | 429 |
| 5- |
|
Isesaki,Gumma | 190,000 | 380 |
| 5- |
|
Hodogaya,Yokohama,Kanagawa | 150,000 | 413 |
| 5- |
|
Saiwai,Kawasaki,Kanagawa | 130,000 | 400 |
| 5- |
|
Inage,Chiba,Chiba | 130,000 | 367 |
| 5- |
|
Gotemba,Shizuoka | 83,000 | 468 |
| 5- |
|
Tochigi,Tochigi | 83,000 | 336 |
| 5- |
|
Yashio,Saitama | 81,000 | 369 |
| 5- |
|
Tatebayashi,Gumma | 75,000 | 359 |
| 5- |
|
Kamagaya,Chiba | 73,000 | 362 |
| 5- |
|
Yotsukaido,Chiba | 65,000 | 361 |
| 5- |
|
Higashiyamato,Tokyo | 62,000 | 402 |
| 5- |
|
Minamiarupusu,Yamanashi | 61,000 | 479 |
| 5- |
|
Okegawa,Saitama | 60,000 | 374 |
| 5- |
|
Wako,Saitama | 59,000 | 387 |
| 5- |
|
Yachimata,Chiba | 57,000 | 353 |
| 5- |
|
Tsurugashima,Saitama | 53,000 | 391 |
| 5- |
|
Minamiboso,Chiba | 39,000 | 434 |
| 5- |
|
Tomisato,Chiba | 38,000 | 346 |
| 5- |
|
Shiwa,Shiwa,Iwate | 27,000 | 217 |
| 5- |
|
Yokoshibahikari,Sambu,Chiba | 22,000 | 342 |
| 5- |
|
Kahoku,Nishimurayama,Yamagata | 19,000 | 224 |
| 5- |
|
Shobu,Minamisaitama,Saitama | 18,000 | 367 |
| 5- |
|
Shichinohe,Kamikita,Aomori | 18,000 | 327 |
| 5- |
|
Hirono,Kunohe,Iwate | 17,000 | 274 |
| 5- |
|
Yoshioka,Kitagumma,Gumma | 14,000 | 387 |
| 5- |
|
Tone,Kitasoma,Ibaraki | 12,000 | 347 |
| 5- |
|
Misato,Kodama,Saitama | 11,000 | 390 |
| 5- |
|
Hanawa,Higashishirakawa,Fukushima | 9,900 | 250 |
| 5- |
|
Yamanakako,Minamitsuru,Yamanashi | 5,400 | 465 |
| 5- |
|
Noda,Kunohe,Iwate | 4,300 | 240 |
| 5- |
|
Kawai,Shimohei,Iwate | 3,100 | 194 |
| 5- |
|
Funabashi,Chiba | 440,000 | 370 |
| 5- |
|
Kita,Tokyo | 290,000 | 381 |
| 5- |
|
Yamagata,Yamagata | 270,000 | 220 |
| 5- |
|
Hiratsuka,Kanagawa | 260,000 | 438 |
| 5- |
|
Aoba,Yokohama,Kanagawa | 210,000 | 409 |
| 5- |
|
Chigasaki,Kanagawa | 170,000 | 435 |
| 5- |
|
Musashino,Tokyo | 160,000 | 395 |
| 5- |
|
Minami,Yokohama,Kanagawa | 130,000 | 414 |
| 5- |
|
Mitaka,Tokyo | 130,000 | 398 |
| 5- |
|
Midori,Yokohama,Kanagawa | 130,000 | 412 |
| 5- |
|
Miyamae,Kawasaki,Kanagawa | 130,000 | 404 |
| 5- |
|
Sakata,Yamagata | 120,000 | 277 |
| 5- |
|
Ome,Tokyo | 120,000 | 409 |
| 5- |
|
Abiko,Chiba | 99,000 | 354 |
| 5- |
|
Seya,Yokohama,Kanagawa | 90,000 | 419 |
| 5- |
|
Sakado,Saitama | 86,000 | 388 |
| 5- |
|
Fuefuki,Yamanashi | 62,000 | 464 |
| 5- |
|
Tendo,Yamagata | 60,000 | 218 |
| 5- |
|
Warabi,Saitama | 57,000 | 379 |
| 5- |
|
Higashine,Yamagata | 47,000 | 218 |
| 5- |
|
Shiki,Saitama | 46,000 | 385 |
| 5- |
|
Moroyama,Iruma,Saitama | 38,000 | 395 |
| 5- |
|
Nanyo,Yamagata | 32,000 | 237 |
| 5- |
|
Murayama,Yamagata | 26,000 | 220 |
| 5- |
|
Fujikawaguchiko,Minamitsuru,Yamanashi | 25,000 | 465 |
| 5- |
|
Matsubushi,Kitakatsushika,Saitama | 23,000 | 362 |
| 5- |
|
Nogi,Shimotsuga,Tochigi | 21,000 | 345 |
| 5- |
|
Shizukuishi,Iwate,Iwate | 17,000 | 240 |
| 5- |
|
Oi,Ashigarakami,Kanagawa | 17,000 | 452 |
| 5- |
|
Kujukuri,Sambu,Chiba | 15,000 | 357 |
| 5- |
|
Ichinohe,Ninohe,Iwate | 15,000 | 270 |
| 5- |
|
Shirataka,Nishiokitama,Yamagata | 14,000 | 241 |
| 5- |
|
Tonosho,Katori,Chiba | 12,000 | 318 |
| 5- |
|
Shioya,Shioya,Tochigi | 11,000 | 303 |
| 5- |
|
Rokunohe,Kamikita,Aomori | 10,000 | 307 |
| 5- |
|
Ikawa,Minamiakita,Akita | 5,500 | 312 |
| 5- |
|
Minamimaki,Minamisaku,Nagano | 3,700 | 451 |
| 5- |
|
Hachioji,Tokyo | 540,000 | 415 |
| 5- |
|
Shinagawa,Tokyo | 460,000 | 393 |
| 5- |
|
Taito,Tokyo | 300,000 | 381 |
| 5- |
|
Koshigaya,Saitama | 250,000 | 367 |
| 5- |
|
Ichihara,Chiba | 240,000 | 379 |
| 5- |
|
Kofu,Yamanashi | 230,000 | 468 |
| 5- |
|
Tsuzuki,Yokohama,Kanagawa | 160,000 | 408 |
| 5- |
|
Hino,Tokyo | 150,000 | 410 |
| 5- |
|
Kodaira,Tokyo | 150,000 | 400 |
| 5- |
|
Urawa,Saitama,Saitama | 140,000 | 379 |
| 5- |
|
Tama,Tokyo | 130,000 | 409 |
| 5- |
|
Nagareyama,Chiba | 110,000 | 362 |
| 5- |
|
Higashimurayama,Tokyo | 110,000 | 398 |
| 5- |
|
Yokote,Akita | 100,000 | 239 |
| 5- |
|
Koganei,Tokyo | 97,000 | 400 |
| 5- |
|
Asaka,Saitama | 92,000 | 387 |
| 5- |
|
Midori,Chiba,Chiba | 80,000 | 370 |
| 5- |
|
Hanno,Saitama | 76,000 | 401 |
| 5- |
|
Ayase,Kanagawa | 75,000 | 425 |
| 5- |
|
Chichibu,Saitama | 68,000 | 409 |
| 5- |
|
Fujimi,Saitama | 67,000 | 385 |
| 5- |
|
Hasuda,Saitama | 49,000 | 368 |
| 5- |
|
Isumi,Chiba | 36,000 | 386 |
| 5- |
|
Mibu,Shimotsuga,Tochigi | 34,000 | 328 |
| 5- |
|
Otsuki,Yamanashi | 28,000 | 445 |
| 5- |
|
Nambu,Sannohe,Aomori | 19,000 | 291 |
| 5- |
|
Itakura,Ora,Gumma | 16,000 | 355 |
| 5- |
|
Kawanishi,Higashiokitama,Yamagata | 16,000 | 246 |
| 5- |
|
Ichikawamisato,Nishiyatsushiro,Yamanashi | 16,000 | 479 |
| 5- |
|
Iwate,Iwate,Iwate | 15,000 | 251 |
| 5- |
|
Shibayama,Sambu,Chiba | 13,000 | 345 |
| 5- |
|
Nakai,Ashigarakami,Kanagawa | 13,000 | 447 |
| 5- |
|
Chosei,Chosei,Chiba | 11,000 | 373 |
| 5- |
|
Yamanobe,Higashimurayama,Yamagata | 11,000 | 227 |
| 5- |
|
Mogami,Mogami,Yamagata | 9,700 | 216 |
| 5- |
|
Nishiaizu,Yama,Fukushima | 7,800 | 287 |
| 5- |
|
Samegawa,Higashishirakawa,Fukushima | 3,700 | 238 |
| 5- |
|
Kanna,Tano,Gumma | 3,200 | 413 |
| 5- |
|
Kuni,Agatsuma,Gumma | 1,700 | 409 |
| 5- |
|
Shinjuku,Tokyo | 810,000 | 388 |
| 5- |
|
Shibuya,Tokyo | 590,000 | 390 |
| 5- |
|
Sagamihara,Kanagawa | 580,000 | 419 |
| 5- |
|
Tokorozawa,Saitama | 270,000 | 395 |
| 5- |
|
Meguro,Tokyo | 240,000 | 392 |
| 5- |
|
Fuchu,Tokyo | 220,000 | 404 |
| 5- |
|
Totsuka,Yokohama,Kanagawa | 200,000 | 422 |
| 5- |
|
Ageo,Saitama | 180,000 | 374 |
| 5- |
|
Nakahara,Kawasaki,Kanagawa | 170,000 | 400 |
| 5- |
|
Sayama,Saitama | 140,000 | 395 |
| 5- |
|
Niiza,Saitama | 130,000 | 389 |
| 5- |
|
Ebina,Kanagawa | 110,000 | 427 |
| 5- |
|
Kokubunji,Tokyo | 86,000 | 402 |
| 5- |
|
Yurihonjo,Akita | 86,000 | 282 |
| 5- |
|
Towada,Aomori | 68,000 | 312 |
| 5- |
|
Minamiuonuma,Niigata | 62,000 | 369 |
| 5- |
|
Annaka,Gumma | 58,000 | 403 |
| 5- |
|
Inagi,Tokyo | 55,000 | 405 |
| 5- |
|
Kitamoto,Saitama | 52,000 | 374 |
| 5- |
|
Midori,Gumma | 46,000 | 369 |
| 5- |
|
Miyoshi,Iruma,Saitama | 45,000 | 389 |
| 5- |
|
Hatogaya,Saitama | 44,000 | 375 |
| 5- |
|
Misawa,Aomori | 42,000 | 313 |
| 5- |
|
Kuji,Iwate | 39,000 | 249 |
| 5- |
|
Oamishirasato,Sambu,Chiba | 34,000 | 365 |
| 5- |
|
Koshu,Yamanashi | 32,000 | 453 |
| 5- |
|
Oohira,Shimotsuga,Tochigi | 26,000 | 341 |
| 5- |
|
Shisui,Imba,Chiba | 16,000 | 350 |
| 5- |
|
Aga,Higashikambara,Niigata | 14,000 | 302 |
| 5- |
|
Yuza,Akumi,Yamagata | 14,000 | 275 |
| 5- |
|
Karumai,Kunohe,Iwate | 10,000 | 274 |
| 5- |
|
Shimogo,Minamiaizu,Fukushima | 6,400 | 279 |
| 5- |
|
Mutsuzawa,Chosei,Chiba | 6,000 | 379 |
| 5- |
|
Tozawa,Mogami,Yamagata | 5,200 | 246 |
| 5- |
|
Okura,Mogami,Yamagata | 3,500 | 238 |
| 5- |
|
Toshima-ku,Tokyo | 380,000 | 384 |
| 5- |
|
Kawagoe,Saitama | 310,000 | 385 |
| 5- |
|
Shimizu,Shizuoka,Shizuoka | 230,000 | 519 |
| 5- |
|
Yamato,Kanagawa | 180,000 | 420 |
| 5- |
|
Konan,Yokohama,Kanagawa | 160,000 | 418 |
| 5- |
|
Tsuruoka,Yamagata | 140,000 | 272 |
| 5- |
|
Nishitokyo,Tokyo | 130,000 | 396 |
| 5- |
|
Izumi,Yokohama,Kanagawa | 110,000 | 423 |
| 5- |
|
Saku,Nagano | 98,000 | 439 |
| 5- |
|
Isehara,Kanagawa | 91,000 | 435 |
| 5- |
|
Zama,Kanagawa | 86,000 | 423 |
| 5- |
|
Mobara,Chiba | 86,000 | 375 |
| 5- |
|
Kimitsu,Chiba | 83,000 | 405 |
| 5- |
|
Honjo,Saitama | 81,000 | 385 |
| 5- |
|
Kiyose,Tokyo | 56,000 | 392 |
| 5- |
|
Tateyama,Chiba | 52,000 | 436 |
| 5- |
|
Komae,Tokyo | 49,000 | 400 |
| 5- |
|
Hokuto,Yamanashi | 47,000 | 471 |
| 5- |
|
Shinjo,Yamagata | 45,000 | 234 |
| 5- |
|
Futtsu,Chiba | 44,000 | 410 |
| 5- |
|
Minamiashigara,Kanagawa | 39,000 | 456 |
| 5- |
|
Ina,Kitaadachi,Saitama | 36,000 | 370 |
| 5- |
|
Kamisato,Kodama,Saitama | 25,000 | 388 |
| 5- |
|
Shonai,Higashitagawa,Yamagata | 21,000 | 270 |
| 5- |
|
Minamiaizu,Minamiaizu,Fukushima | 20,000 | 289 |
| 5- |
|
Ranzan,Hiki,Saitama | 20,000 | 387 |
| 5- |
|
Noheji,Kamikita,Aomori | 15,000 | 340 |
| 5- |
|
Sannohe,Sannohe,Aomori | 12,000 | 287 |
| 5- |
|
Matsuda,Ashigarakami,Kanagawa | 11,000 | 451 |
| 5- |
|
Tsuga,Shimotsuga,Tochigi | 11,000 | 332 |
| 5- |
|
Mikawa,Higashitagawa,Yamagata | 9,200 | 272 |
| 5- |
|
Yokoze,Chichibu,Saitama | 7,700 | 408 |
| 5- |
|
Kuzumaki,Iwate,Iwate | 7,400 | 247 |
| 5- |
|
Oishida,Kitamurayama,Yamagata | 7,400 | 223 |
| 5- |
|
Nishikata,Kamitsuga,Tochigi | 6,200 | 330 |
| 5- |
|
Atsuma,Yufutsu,Hokkaido | 5,500 | 520 |
| 5- |
|
Funagata,Mogami,Yamagata | 5,400 | 230 |
| 5- |
|
Kariwa,Kariwa,Niigata | 4,600 | 379 |
| 5- |
|
Yanaizu,Kawanuma,Fukushima | 3,900 | 283 |
| 5- |
|
Kajikazawa,Minamikoma,Yamanashi | 3,600 | 483 |
| 4 |
|
Tsurumi,Yokohama,Kanagawa | 220,000 | 404 |
| 4 |
|
Kanazawa,Yokohama,Kanagawa | 180,000 | 421 |
| 4 |
|
Tama,Kawasaki,Kanagawa | 150,000 | 403 |
| 4 |
|
Asao,Kawasaki,Kanagawa | 110,000 | 407 |
| 4 |
|
Murakami,Niigata | 67,000 | 295 |
| 4 |
|
Mutsu,Aomori | 62,000 | 381 |
| 4 |
|
Suwa,Nagano | 56,000 | 479 |
| 4 |
|
Kai,Yamanashi | 56,000 | 472 |
| 4 |
|
Yuzawa,Akita | 55,000 | 236 |
| 4 |
|
Sodegaura,Chiba | 51,000 | 394 |
| 4 |
|
Fujiyoshida,Yamanashi | 51,000 | 463 |
| 4 |
|
Izunokuni,Shizuoka | 46,000 | 490 |
| 4 |
|
Aikawa,Aiko,Kanagawa | 41,000 | 425 |
| 4 |
|
Mitsuke,Niigata | 36,000 | 352 |
| 4 |
|
Tamamura,Sawa,Gumma | 33,000 | 387 |
| 4 |
|
Nikaho,Akita | 29,000 | 283 |
| 4 |
|
Showa,Nakakoma,Yamanashi | 24,000 | 473 |
| 4 |
|
Mitane,Yamamoto,Akita | 17,000 | 331 |
| 4 |
|
Namegawa,Hiki,Saitama | 17,000 | 384 |
| 4 |
|
Kaisei,Ashigarakami,Kanagawa | 13,000 | 453 |
| 4 |
|
Ichinomiya,Chosei,Chiba | 10,000 | 376 |
| 4 |
|
Nagara,Chosei,Chiba | 7,800 | 378 |
| 4 |
|
Nagatoro,Chichibu,Saitama | 6,900 | 399 |
| 4 |
|
Takko,Sannohe,Aomori | 6,800 | 288 |
| 4 |
|
Nishikawa,Nishimurayama,Yamagata | 5,900 | 239 |
| 4 |
|
Aomori,Aomori | 310,000 | 352 |
| 4 |
|
Takatsu,Kawasaki,Kanagawa | 150,000 | 401 |
| 4 |
|
Iruma,Saitama | 120,000 | 398 |
| 4 |
|
Fujimino,Saitama | 81,000 | 386 |
| 4 |
|
Kunitachi,Tokyo | 68,000 | 405 |
| 4 |
|
Chino,Nagano | 54,000 | 478 |
| 4 |
|
Hidaka,Saitama | 44,000 | 396 |
| 4 |
|
Sagae,Yamagata | 43,000 | 227 |
| 4 |
|
Kamogawa,Chiba | 37,000 | 413 |
| 4 |
|
Semboku,Akita | 31,000 | 255 |
| 4 |
|
Kamo,Niigata | 29,000 | 338 |
| 4 |
|
Uenohara,Yamanashi | 28,000 | 432 |
| 4 |
|
Misato,Semboku,Akita | 21,000 | 248 |
| 4 |
|
Hatoyama,Hiki,Saitama | 15,000 | 391 |
| 4 |
|
Hiranai,Higashitsugaru,Aomori | 12,000 | 353 |
| 4 |
|
Shinto,Kitagumma,Gumma | 11,000 | 389 |
| 4 |
|
Tokigawa,Hiki,Saitama | 11,000 | 392 |
| 4 |
|
Minano,Chichibu,Saitama | 11,000 | 402 |
| 4 |
|
Mamurogawa,Mogami,Yamagata | 8,700 | 241 |
| 4 |
|
Oe,Nishimurayama,Yamagata | 8,400 | 233 |
| 4 |
|
Nishiwaga,Waga,Iwate | 7,300 | 225 |
| 4 |
|
Katashina,Tone,Gumma | 5,300 | 353 |
| 4 |
|
Narusawa,Minamitsuru,Yamanashi | 3,300 | 470 |
| 4 |
|
Kiyokawa,Aiko,Kanagawa | 3,200 | 432 |
| 4 |
|
Nagaoka,Niigata | 290,000 | 360 |
| 4 |
|
Numazu,Shizuoka | 230,000 | 489 |
| 4 |
|
Tachikawa,Tokyo | 190,000 | 406 |
| 4 |
|
Hadano,Kanagawa | 130,000 | 444 |
| 4 |
|
Isogo,Yokohama,Kanagawa | 120,000 | 416 |
| 4 |
|
Iida,Nagano | 110,000 | 532 |
| 4 |
|
Fujinomiya,Shizuoka | 110,000 | 495 |
| 4 |
|
Sakae,Yokohama,Kanagawa | 88,000 | 423 |
| 4 |
|
Higashikurume,Tokyo | 80,000 | 394 |
| 4 |
|
Akiha,Niigata,Niigata | 63,000 | 330 |
| 4 |
|
Zushi,Kanagawa | 46,000 | 427 |
| 4 |
|
Kazuno,Akita | 36,000 | 294 |
| 4 |
|
Mizuho,Nishitama,Tokyo | 33,000 | 405 |
| 4 |
|
Nirasaki,Yamanashi | 32,000 | 474 |
| 4 |
|
Ogawa,Hiki,Saitama | 27,000 | 392 |
| 4 |
|
Yoshii,Tano,Gumma | 22,000 | 399 |
| 4 |
|
Karuizawa,Kitasaku,Nagano | 20,000 | 424 |
| 4 |
|
Higashiagatsuma,Agatsuma,Gumma | 17,000 | 395 |
| 4 |
|
Fujimi,Suwa,Nagano | 15,000 | 476 |
| 4 |
|
Kamikawa,Kodama,Saitama | 14,000 | 393 |
| 4 |
|
Masuho,Minamikoma,Yamanashi | 11,000 | 482 |
| 4 |
|
Yamakita,Ashigarakami,Kanagawa | 11,000 | 454 |
| 4 |
|
Gojome,Minamiakita,Akita | 10,000 | 313 |
| 4 |
|
Chonan,Chosei,Chiba | 8,900 | 382 |
| 4 |
|
Iide,Nishiokitama,Yamagata | 7,600 | 251 |
| 4 |
|
Sotogahama,Higashitsugaru,Aomori | 7,400 | 378 |
| 4 |
|
Asahi,Nishimurayama,Yamagata | 7,300 | 237 |
| 4 |
|
Sakegawa,Mogami,Yamagata | 4,700 | 242 |
| 4 |
|
Nishikatsura,Minamitsuru,Yamanashi | 4,000 | 458 |
| 4 |
|
Kitashiobara,Yama,Fukushima | 3,600 | 261 |
| 4 |
|
Fujisawa,Kanagawa | 370,000 | 429 |
| 4 |
|
Yokosuka,Kanagawa | 360,000 | 423 |
| 4 |
|
Hakodate,Hokkaido | 300,000 | 445 |
| 4 |
|
Sanjo,Niigata | 110,000 | 345 |
| 4 |
|
Shibata,Niigata | 99,000 | 309 |
| 4 |
|
Akishima,Tokyo | 98,000 | 410 |
| 4 |
|
Odate,Akita | 82,000 | 311 |
| 4 |
|
Akiruno,Tokyo | 64,000 | 412 |
| 4 |
|
Tomioka,Gumma | 53,000 | 407 |
| 4 |
|
Minami,Niigata,Niigata | 44,000 | 338 |
| 4 |
|
Agano,Niigata | 41,000 | 319 |
| 4 |
|
Miura,Kanagawa | 39,000 | 438 |
| 4 |
|
Izu,Shizuoka | 34,000 | 493 |
| 4 |
|
Shimizu,Sunto,Shizuoka | 32,000 | 486 |
| 4 |
|
Hirakawa,Aomori | 32,000 | 338 |
| 4 |
|
Oyama,Sunto,Shizuoka | 21,000 | 460 |
| 4 |
|
Fujisaki,Minamitsugaru,Aomori | 15,000 | 348 |
| 4 |
|
Tsuruta,Kitatsugaru,Aomori | 14,000 | 361 |
| 4 |
|
Miyota,Kitasaku,Nagano | 14,000 | 433 |
| 4 |
|
Ogano,Chichibu,Saitama | 13,000 | 413 |
| 4 |
|
Kanra,Kanra,Gumma | 12,000 | 405 |
| 4 |
|
Ogose,Iruma,Saitama | 11,000 | 395 |
| 4 |
|
Nishiizu,Kamo,Shizuoka | 10,000 | 520 |
| 4 |
|
Oguni,Nishiokitama,Yamagata | 9,700 | 272 |
| 4 |
|
Showa,Tone,Gumma | 6,600 | 372 |
| 4 |
|
Niikappu,Niikappu,Hokkaido | 5,800 | 475 |
| 4 |
|
Yokohama,Kamikita,Aomori | 5,100 | 358 |
| 4 |
|
Higashichichibu,Chichibu,Saitama | 2,800 | 396 |
| 4 |
|
Kosuge,Kitatsuru,Yamanashi | 1,000 | 435 |
| 4 |
|
Joetsu,Niigata | 200,000 | 420 |
| 4 |
|
Kamakura,Kanagawa | 160,000 | 427 |
| 4 |
|
Higashi,Niigata,Niigata | 120,000 | 332 |
| 4 |
|
Mishima,Shizuoka | 100,000 | 483 |
| 4 |
|
Ito,Shizuoka | 68,000 | 484 |
| 4 |
|
Noshiro,Akita | 64,000 | 338 |
| 4 |
|
Makinohara,Shizuoka | 50,000 | 558 |
| 4 |
|
Tsugaru,Aomori | 38,000 | 368 |
| 4 |
|
Katagami,Akita | 29,000 | 317 |
| 4 |
|
Oiso,Naka,Kanagawa | 25,000 | 443 |
| 4 |
|
Minakami,Tone,Gumma | 22,000 | 376 |
| 4 |
|
Seiro,Kitakambara,Niigata | 20,000 | 314 |
| 4 |
|
Ugo,Ogachi,Akita | 16,000 | 244 |
| 4 |
|
Itayanagi,Kitatsugaru,Aomori | 15,000 | 354 |
| 4 |
|
Otaki,Isumi,Chiba | 12,000 | 390 |
| 4 |
|
Tsumagoi,Agatsuma,Gumma | 11,000 | 421 |
| 4 |
|
Namporo,Sorachi,Hokkaido | 7,900 | 560 |
| 4 |
|
Taiki,Hiro,Hokkaido | 6,700 | 489 |
| 4 |
|
Urahoro,Tokachi,Hokkaido | 6,000 | 527 |
| 4 |
|
Takayama,Agatsuma,Gumma | 3,700 | 383 |
| 4 |
|
Kozushima,Tokyo | 2,100 | 547 |
| 4 |
|
Chuo,Niigata,Niigata | 260,000 | 335 |
| 4 |
|
Obihiro,Hokkaido | 170,000 | 536 |
| 4 |
|
Nishi,Niigata,Niigata | 140,000 | 341 |
| 4 |
|
Tsubame,Niigata | 83,000 | 348 |
| 4 |
|
Nakatsugawa,Gifu | 83,000 | 558 |
| 4 |
|
Hamura,Tokyo | 55,000 | 408 |
| 4 |
|
Gosen,Niigata | 50,000 | 324 |
| 4 |
|
Fussa,Tokyo | 44,000 | 409 |
| 4 |
|
Kitaakita,Akita | 38,000 | 318 |
| 4 |
|
Yamanashi,Yamanashi | 34,000 | 457 |
| 4 |
|
Minobu,Minamikoma,Yamanashi | 16,000 | 490 |
| 4 |
|
Rokkasho,Kamikita,Aomori | 13,000 | 342 |
| 4 |
|
Takamori,Shimoina,Nagano | 12,000 | 526 |
| 4 |
|
Naganuma,Yubari,Hokkaido | 12,000 | 554 |
| 4 |
|
Tagami,Minamikambara,Niigata | 11,000 | 336 |
| 4 |
|
Iijima,Kamiina,Nagano | 9,100 | 515 |
| 4 |
|
Kusatsu,Agatsuma,Gumma | 8,300 | 411 |
| 4 |
|
Yahiko,Nishikambara,Niigata | 7,400 | 354 |
| 4 |
|
Hara,Suwa,Nagano | 6,700 | 475 |
| 4 |
|
Onjuku,Isumi,Chiba | 6,700 | 393 |
| 4 |
|
Hachirogata,Minamiakita,Akita | 5,900 | 315 |
| 4 |
|
Tanohata,Shimohei,Iwate | 4,000 | 219 |
| 4 |
|
Shinshinotsu,Ishikari,Hokkaido | 3,700 | 578 |
| 4 |
|
Kushiro,Hokkaido | 190,000 | 557 |
| 4 |
|
Fuji,Shizuoka | 250,000 | 496 |
| 4 |
|
Hirosaki,Aomori | 190,000 | 345 |
| 4 |
|
Minato,Nagoya,Aichi | 160,000 | 628 |
| 4 |
|
Fujioka,Gumma | 63,000 | 393 |
| 4 |
|
Goshogawara,Aomori | 62,000 | 365 |
| 4 |
|
Nishikan,Niigata,Niigata | 56,000 | 350 |
| 4 |
|
Susono,Shizuoka | 55,000 | 480 |
| 4 |
|
Nagaizumi,Sunto,Shizuoka | 40,000 | 483 |
| 4 |
|
Otofuke,Kato,Hokkaido | 36,000 | 544 |
| 4 |
|
Kuroishi,Aomori | 35,000 | 342 |
| 4 |
|
Kannami,Tagata,Shizuoka | 30,000 | 483 |
| 4 |
|
Yorii,Osato,Saitama | 30,000 | 393 |
| 4 |
|
Shinhidaka,Hidaka,Hokkaido | 27,000 | 472 |
| 4 |
|
Hayama,Miura,Kanagawa | 23,000 | 429 |
| 4 |
|
Nakanojo,Agatsuma,Gumma | 17,000 | 393 |
| 4 |
|
Higashiizu,Kamo,Shizuoka | 15,000 | 503 |
| 4 |
|
Sakuho,Minamisaku,Nagano | 11,000 | 443 |
| 4 |
|
Mukawa,Yufutsu,Hokkaido | 10,000 | 503 |
| 4 |
|
Oma,Shimokita,Aomori | 6,400 | 415 |
| 4 |
|
Manazuru,Ashigarashimo,Kanagawa | 6,100 | 466 |
| 4 |
|
Kaneyama,Mogami,Yamagata | 5,900 | 235 |
| 4 |
|
Tadami,Minamiaizu,Fukushima | 5,300 | 322 |
| 4 |
|
Kawakami,Minamisaku,Nagano | 4,800 | 447 |
| 4 |
|
Yomogita,Higashitsugaru,Aomori | 2,700 | 370 |
| 4 |
|
Aoi,Shizuoka,Shizuoka | 270,000 | 530 |
| 4 |
|
Yaizu,Shizuoka | 130,000 | 542 |
| 4 |
|
Kashiwazaki,Niigata | 94,000 | 386 |
| 4 |
|
Ina,Nagano | 70,000 | 503 |
| 4 |
|
Konan,Niigata,Niigata | 61,000 | 330 |
| 4 |
|
Komoro,Nagano | 43,000 | 439 |
| 4 |
|
Hokuto,Hokkaido | 41,000 | 454 |
| 4 |
|
Tsuru,Yamanashi | 34,000 | 452 |
| 4 |
|
Oga,Akita | 32,000 | 326 |
| 4 |
|
Tainai,Niigata | 32,000 | 301 |
| 4 |
|
Nagai,Yamagata | 31,000 | 246 |
| 4 |
|
Katsura,Chiba | 21,000 | 398 |
| 4 |
|
Hakone,Ashigarashimo,Kanagawa | 20,000 | 462 |
| 4 |
|
Matsukawa,Shimoina,Nagano | 13,000 | 521 |
| 4 |
|
Tobishima,Ama,Aichi | 12,000 | 637 |
| 4 |
|
Matsuzaki,Kamo,Shizuoka | 7,600 | 521 |
| 4 |
|
Inakadate,Minamitsugaru,Aomori | 7,200 | 343 |
| 4 |
|
Sekikawa,Iwafune,Niigata | 5,900 | 288 |
| 4 |
|
Kaminokuni,Hiyama,Hokkaido | 5,600 | 472 |
| 4 |
|
Kawaguchi,Kitauonuma,Niigata | 4,500 | 363 |
| 4 |
|
Toyokoro,Nakagawa,Hokkaido | 3,700 | 524 |
| 4 |
|
Fujisato,Yamamoto,Akita | 3,600 | 329 |
| 4 |
|
Showa,Onuma,Fukushima | 1,600 | 298 |
| 4 |
|
Nagano,Nagano | 380,000 | 442 |
| 4 |
|
Ueda,Nagano | 170,000 | 449 |
| 4 |
|
Chikusa,Nagoya,Aichi | 150,000 | 620 |
| 4 |
|
Chitose,Hokkaido | 92,000 | 534 |
| 4 |
|
Iwamizawa,Hokkaido | 87,000 | 573 |
| 4 |
|
Fukuroi,Shizuoka | 79,000 | 577 |
| 4 |
|
Kita,Niigata,Niigata | 67,000 | 319 |
| 4 |
|
Miyoshi,Nishikamo,Aichi | 60,000 | 615 |
| 4 |
|
Yatomi,Aichi | 40,000 | 640 |
| 4 |
|
Komagane,Nagano | 35,000 | 511 |
| 4 |
|
Kaizu,Gifu | 32,000 | 640 |
| 4 |
|
Kanie,Ama,Aichi | 29,000 | 634 |
| 4 |
|
Memuro,Kasai,Hokkaido | 20,000 | 534 |
| 4 |
|
Shippo,Ama,Aichi | 18,000 | 631 |
| 4 |
|
Kiso-machi,Kiso,Nagano | 14,000 | 523 |
| 4 |
|
Hinode,Nishitama,Tokyo | 14,000 | 414 |
| 4 |
|
Nakadomari,Kitatsugaru,Aomori | 13,000 | 379 |
| 4 |
|
Oshima,Tokyo | 8,700 | 487 |
| 4 |
|
Miyada,Kamiina,Nagano | 8,200 | 508 |
| 4 |
|
Tateshina,Kitasaku,Nagano | 7,800 | 451 |
| 4 |
|
Kosaka,Kazuno,Akita | 7,600 | 306 |
| 4 |
|
Samani,Samani,Hokkaido | 5,200 | 447 |
| 4 |
|
Izumozaki,Santo,Niigata | 4,600 | 369 |
| 4 |
|
Ogata,Minamiakita,Akita | 3,700 | 328 |
| 4 |
|
Kamikoani,Kitaakita,Akita | 2,700 | 310 |
| 4 |
|
Doshi,Minamitsuru,Yamanashi | 1,700 | 445 |
| 4 |
|
Ueno,Tano,Gumma | 1,400 | 426 |
| 4 |
|
Suruga,Shizuoka,Shizuoka | 210,000 | 529 |
| 4 |
|
Tomakomai,Hokkaido | 170,000 | 514 |
| 4 |
|
Iwata,Shizuoka | 170,000 | 585 |
| 4 |
|
Moriyama,Nagoya,Aichi | 130,000 | 615 |
| 4 |
|
Fujieda,Shizuoka | 130,000 | 546 |
| 4 |
|
Inazawa,Aichi | 130,000 | 628 |
| 4 |
|
Atsuta,Nagoya,Aichi | 89,000 | 625 |
| 4 |
|
Sado,Niigata | 67,000 | 393 |
| 4 |
|
Tokamachi,Niigata | 60,000 | 377 |
| 4 |
|
Tsushima,Aichi | 58,000 | 635 |
| 4 |
|
Aisai,Aichi | 55,000 | 637 |
| 4 |
|
Uonuma,Niigata | 42,000 | 356 |
| 4 |
|
Atami,Shizuoka | 41,000 | 475 |
| 4 |
|
Togo,Aichi,Aichi | 33,000 | 616 |
| 4 |
|
Jimokuji,Ama,Aichi | 29,000 | 627 |
| 4 |
|
Urakawa,Urakawa,Hokkaido | 15,000 | 451 |
| 4 |
|
Ajigasawa,Nishitsugaru,Aomori | 12,000 | 374 |
| 4 |
|
Shiranuka,Shiranuka,Hokkaido | 11,000 | 548 |
| 4 |
|
Nambu,Minamikoma,Yamanashi | 8,700 | 503 |
| 4 |
|
Ikeda,Nakagawa,Hokkaido | 8,200 | 538 |
| 4 |
|
Kawazu,Kamo,Shizuoka | 7,600 | 508 |
| 4 |
|
Achi,Shimoina,Nagano | 7,400 | 542 |
| 4 |
|
Biratori,Saru,Hokkaido | 6,200 | 501 |
| 4 |
|
Okutama,Nishitama,Tokyo | 6,000 | 420 |
| 4 |
|
Shikaoi,Kato,Hokkaido | 6,000 | 555 |
| 4 |
|
Shiriuchi,Kamiiso,Hokkaido | 5,300 | 440 |
| 4 |
|
Nakafurano,Sorachi,Hokkaido | 5,200 | 590 |
| 4 |
|
Nagiso,Kiso,Nagano | 5,100 | 543 |
| 4 |
|
Sarabetsu,Kasai,Hokkaido | 3,500 | 506 |
| 4 |
|
Imabetsu,Higashitsugaru,Aomori | 3,200 | 397 |
| 4 |
|
Nishimeya,Nakatsugaru,Aomori | 1,700 | 352 |
| 4 |
|
Tabayama,Kitatsuru,Yamanashi | 790 | 434 |
| 4 |
|
Hinoemata,Minamiaizu,Fukushima | 700 | 328 |
| 3 |
|
Kita,Sapporo,Hokkaido | 250,000 | 568 |
| 3 |
|
Anjo,Aichi | 180,000 | 623 |
| 3 |
|
Kariya,Aichi | 170,000 | 627 |
| 3 |
|
Kita,Nagoya,Aichi | 140,000 | 621 |
| 3 |
|
Minami,Nagoya,Aichi | 140,000 | 625 |
| 3 |
|
Eniwa,Hokkaido | 62,000 | 542 |
| 3 |
|
Kiyosu,Aichi | 48,000 | 625 |
| 3 |
|
Ojiya,Niigata | 40,000 | 368 |
| 3 |
|
Minowa,Kamiina,Nagano | 25,000 | 496 |
| 3 |
|
Iiyama,Nagano | 24,000 | 420 |
| 3 |
|
Makubetsu,Nakagawa,Hokkaido | 24,000 | 535 |
| 3 |
|
Kushiro,Kushiro,Hokkaido | 21,000 | 560 |
| 3 |
|
Oharu,Ama,Aichi | 21,000 | 629 |
| 3 |
|
Miwa,Ama,Aichi | 19,000 | 630 |
| 3 |
|
Shimizu,Kamikawa,Hokkaido | 11,000 | 545 |
| 3 |
|
Yuzawa,Minamiuonuma,Niigata | 10,000 | 379 |
| 3 |
|
Abira,Yufutsu,Hokkaido | 9,600 | 525 |
| 3 |
|
Wanochi,Ampachi,Gifu | 9,100 | 637 |
| 3 |
|
Ozora,Abashiri,Hokkaido | 8,600 | 654 |
| 3 |
|
Shibetsu,Shibetsu,Hokkaido | 6,300 | 646 |
| 3 |
|
Takagi,Shimoina,Nagano | 6,100 | 529 |
| 3 |
|
Assabu,Hiyama,Hokkaido | 4,700 | 479 |
| 3 |
|
Nakasatsunai,Kasai,Hokkaido | 4,200 | 511 |
| 3 |
|
Kaneyama,Onuma,Fukushima | 3,000 | 301 |
| 3 |
|
Chippubetsu,Uryu,Hokkaido | 2,900 | 633 |
| 3 |
|
Hinohara,Nishitama,Tokyo | 2,600 | 422 |
| 3 |
|
Mishima,Onuma,Fukushima | 2,200 | 291 |
| 3 |
|
Yasuoka,Shimoina,Nagano | 1,900 | 539 |
| 3 |
|
Gifu,Gifu | 430,000 | 619 |
| 3 |
|
Kasugai,Aichi | 260,000 | 613 |
| 3 |
|
Nakagawa,Nagoya,Aichi | 180,000 | 628 |
| 3 |
|
Ogaki,Gifu | 160,000 | 634 |
| 3 |
|
Showa,Nagoya,Aichi | 140,000 | 622 |
| 3 |
|
Tempaku,Nagoya,Aichi | 130,000 | 620 |
| 3 |
|
Muroran,Hokkaido | 110,000 | 494 |
| 3 |
|
Mizuho,Nagoya,Aichi | 110,000 | 623 |
| 3 |
|
Takayama,Gifu | 97,000 | 542 |
| 3 |
|
Owariasahi,Aichi | 65,000 | 610 |
| 3 |
|
Chiryu,Aichi | 58,000 | 622 |
| 3 |
|
Hashima,Gifu | 55,000 | 629 |
| 3 |
|
Tomi,Nagano | 28,000 | 445 |
| 3 |
|
Shimosuwa,Suwa,Nagano | 21,000 | 480 |
| 3 |
|
Kasamatsu,Hashima,Gifu | 20,000 | 622 |
| 3 |
|
Shiraoi,Shiraoi,Hokkaido | 20,000 | 510 |
| 3 |
|
Suzu,Ishikawa | 18,000 | 497 |
| 3 |
|
Sakaki,Hanishina,Nagano | 17,000 | 452 |
| 3 |
|
Kuriyama,Yubari,Hokkaido | 15,000 | 557 |
| 3 |
|
Hidaka,Saru,Hokkaido | 15,000 | 490 |
| 3 |
|
Ampachi,Ampachi,Gifu | 14,000 | 631 |
| 3 |
|
Akkeshi,Akkeshi,Hokkaido | 11,000 | 575 |
| 3 |
|
Shinano,Kamiminochi,Nagano | 8,800 | 435 |
| 3 |
|
Shintotsukawa,Kabato,Hokkaido | 7,300 | 610 |
| 3 |
|
Shihoro,Kato,Hokkaido | 7,000 | 563 |
| 3 |
|
Komi,Minamisaku,Nagano | 5,900 | 447 |
| 3 |
|
Toyoka,Shimoina,Nagano | 5,600 | 525 |
| 3 |
|
Kikonai,Kamiiso,Hokkaido | 5,500 | 447 |
| 3 |
|
Sobetsu,Usu,Hokkaido | 3,900 | 522 |
| 3 |
|
Moseushi,Uryu,Hokkaido | 3,900 | 626 |
| 3 |
|
Naka,Nagoya,Aichi | 350,000 | 623 |
| 3 |
|
Toyohashi,Aichi | 350,000 | 613 |
| 3 |
|
Matsumoto,Nagano | 250,000 | 480 |
| 3 |
|
Nakamura,Nagoya,Aichi | 250,000 | 625 |
| 3 |
|
Nishi,Nagoya,Aichi | 150,000 | 623 |
| 3 |
|
Higashi,Nagoya,Aichi | 140,000 | 621 |
| 3 |
|
Joto,Osaka,Osaka | 130,000 | 755 |
| 3 |
|
Daito,Osaka | 130,000 | 749 |
| 3 |
|
Ebetsu,Hokkaido | 110,000 | 566 |
| 3 |
|
Hikone,Shiga | 110,000 | 667 |
| 3 |
|
Teine,Sapporo,Hokkaido | 100,000 | 574 |
| 3 |
|
Nisshin,Aichi | 92,000 | 615 |
| 3 |
|
Obu,Aichi | 79,000 | 628 |
| 3 |
|
Ishikari,Hokkaido | 56,000 | 578 |
| 3 |
|
Ena,Gifu | 53,000 | 567 |
| 3 |
|
Shinshiro,Aichi | 48,000 | 597 |
| 3 |
|
Nagakute,Aichi,Aichi | 47,000 | 611 |
| 3 |
|
Himi,Toyama | 45,000 | 536 |
| 3 |
|
Mizuho,Gifu | 42,000 | 626 |
| 3 |
|
Noto,Hosu,Ishikawa | 21,000 | 509 |
| 3 |
|
Betsukai,Notsuke,Hokkaido | 16,000 | 618 |
| 3 |
|
Minamiminowa,Kamiina,Nagano | 13,000 | 499 |
| 3 |
|
Azuchi,Gamo,Shiga | 9,100 | 684 |
| 3 |
|
Shibakawa,Fuji,Shizuoka | 7,600 | 501 |
| 3 |
|
Happo,Yamamoto,Akita | 7,500 | 350 |
| 3 |
|
Anan,Shimoina,Nagano | 5,900 | 545 |
| 3 |
|
Numata,Uryu,Hokkaido | 4,100 | 638 |
| 3 |
|
Tsurui,Akan,Hokkaido | 3,000 | 582 |
| 3 |
|
Hokuryu,Uryu,Hokkaido | 2,500 | 630 |
| 3 |
|
Miyake,Miyakejima,Tokyo | 2,400 | 541 |
| 3 |
|
Hayakawa,Minamikoma,Yamanashi | 1,600 | 499 |
| 3 |
|
Hiraya,Shimoina,Nagano | 690 | 559 |
| 3 |
|
Toshima-mura,Tokyo | 360 | 510 |
| 3 |
|
Naka,Hamamatsu,Shizuoka | 250,000 | 594 |
| 3 |
|
Kitami,Hokkaido | 120,000 | 639 |
| 3 |
|
Kakegawa,Shizuoka | 110,000 | 571 |
| 3 |
|
Minami,Hamamatsu,Shizuoka | 100,000 | 595 |
| 3 |
|
Kita,Hamamatsu,Shizuoka | 90,000 | 592 |
| 3 |
|
Tsurumi,Osaka,Osaka | 90,000 | 753 |
| 3 |
|
Kiyota,Sapporo,Hokkaido | 86,000 | 557 |
| 3 |
|
Higashinari,Osaka,Osaka | 78,000 | 757 |
| 3 |
|
Konohana,Osaka,Osaka | 73,000 | 764 |
| 3 |
|
Omihachiman,Shiga | 62,000 | 687 |
| 3 |
|
Toyoake,Aichi | 62,000 | 622 |
| 3 |
|
Kitahiroshima,Hokkaido | 55,000 | 553 |
| 3 |
|
Kosai,Shizuoka | 47,000 | 607 |
| 3 |
|
Yasu,Shiga | 46,000 | 697 |
| 3 |
|
Takikawa,Hokkaido | 44,000 | 611 |
| 3 |
|
Kikugawa,Shizuoka | 43,000 | 566 |
| 3 |
|
Takahama,Aichi | 37,000 | 632 |
| 3 |
|
Omaezaki,Shizuoka | 33,000 | 572 |
| 3 |
|
Nakashibetsu,Shibetsu,Hokkaido | 24,000 | 631 |
| 3 |
|
Sunagawa,Hokkaido | 21,000 | 604 |
| 3 |
|
Tobetsu,Ishikari,Hokkaido | 19,000 | 580 |
| 3 |
|
Kozakai,Hoi,Aichi | 18,000 | 613 |
| 3 |
|
Nakanoto,Kashima,Ishikawa | 16,000 | 539 |
| 3 |
|
Ryuo,Gamo,Shiga | 14,000 | 689 |
| 3 |
|
Oyamazaki,Otokuni,Kyoto | 13,000 | 732 |
| 3 |
|
Haruhi,Nishikasugai,Aichi | 11,000 | 624 |
| 3 |
|
Fukaura,Nishitsugaru,Aomori | 10,000 | 378 |
| 3 |
|
Owani,Minamitsugaru,Aomori | 9,900 | 332 |
| 3 |
|
Iizuna,Kamiminochi,Nagano | 9,700 | 434 |
| 3 |
|
Hazu,Hazu,Aichi | 9,200 | 631 |
| 3 |
|
Hamanaka,Akkeshi,Hokkaido | 7,000 | 585 |
| 3 |
|
Shintoku,Kamikawa,Hokkaido | 6,900 | 553 |
| 3 |
|
Kamishihoro,Kato,Hokkaido | 5,200 | 571 |
| 3 |
|
Shimojo,Shimoina,Nagano | 3,900 | 542 |
| 3 |
|
Tenryu,Shimoina,Nagano | 1,900 | 545 |
| 3 |
|
Minamiaiki,Minamisaku,Nagano | 960 | 446 |
| 3 |
|
Kitaaiki,Minamisaku,Nagano | 760 | 444 |
| 3 |
|
Ichinomiya,Aichi | 310,000 | 623 |
| 3 |
|
Neyagawa,Osaka | 200,000 | 745 |
| 3 |
|
Shiroishi,Sapporo,Hokkaido | 170,000 | 562 |
| 3 |
|
Ikuno,Osaka,Osaka | 130,000 | 759 |
| 3 |
|
Handa,Aichi | 110,000 | 638 |
| 3 |
|
Tokai,Aichi | 100,000 | 632 |
| 3 |
|
Nishi,Hamamatsu,Shizuoka | 94,000 | 601 |
| 3 |
|
Toyoka,Hyogo | 89,000 | 769 |
| 3 |
|
Azumino,Nagano | 84,000 | 482 |
| 3 |
|
Nagahama,Shiga | 80,000 | 659 |
| 3 |
|
Kitanagoya,Aichi | 70,000 | 621 |
| 3 |
|
Taisho,Osaka,Osaka | 69,000 | 764 |
| 3 |
|
Chikuma,Nagano | 58,000 | 453 |
| 3 |
|
Okaya,Nagano | 53,000 | 483 |
| 3 |
|
Shijonawate,Osaka | 44,000 | 746 |
| 3 |
|
Nakano,Nagano | 44,000 | 424 |
| 3 |
|
Higashiura,Chita,Aichi | 40,000 | 630 |
| 3 |
|
Mizunami,Gifu | 38,000 | 585 |
| 3 |
|
Myoko,Niigata | 37,000 | 423 |
| 3 |
|
Maibara,Shiga | 36,000 | 662 |
| 3 |
|
Date,Hokkaido | 36,000 | 514 |
| 3 |
|
Taketoyo,Chita,Aichi | 34,000 | 642 |
| 3 |
|
Wajima,Ishikawa | 31,000 | 529 |
| 3 |
|
Omachi,Nagano | 31,000 | 477 |
| 3 |
|
Bibai,Hokkaido | 29,000 | 587 |
| 3 |
|
Mihama,Chita,Aichi | 23,000 | 648 |
| 3 |
|
Hino,Gamo,Shiga | 22,000 | 682 |
| 3 |
|
Tatsuno,Kamiina,Nagano | 20,000 | 492 |
| 3 |
|
Agui,Chita,Aichi | 20,000 | 637 |
| 3 |
|
Ono,Ibi,Gifu | 19,000 | 627 |
| 3 |
|
Mori,Kayabe,Hokkaido | 18,000 | 485 |
| 3 |
|
Kutchan,Abuta,Hokkaido | 16,000 | 561 |
| 3 |
|
Tsunan,Nakauonuma,Niigata | 11,000 | 390 |
| 3 |
|
Toyako,Abuta,Hokkaido | 11,000 | 525 |
| 3 |
|
Shimonita,Kanra,Gumma | 9,700 | 417 |
| 3 |
|
Shibecha,Kawakami,Hokkaido | 9,000 | 596 |
| 3 |
|
Ashoro,Ashoro,Hokkaido | 8,300 | 574 |
| 3 |
|
Yamagata,Higashichikuma,Nagano | 7,100 | 491 |
| 3 |
|
Agematsu,Kiso,Nagano | 5,600 | 526 |
| 3 |
|
Mashike,Mashike,Hokkaido | 5,400 | 649 |
| 3 |
|
Shinshu-shinmachi,Kamiminochi,Nagano | 5,300 | 461 |
| 3 |
|
Sai,Shimokita,Aomori | 2,700 | 407 |
| 3 |
|
Sakae,Shimominochi,Nagano | 2,400 | 397 |
| 3 |
|
Nakajo,Kamiminochi,Nagano | 2,400 | 457 |
| 3 |
|
Seinaiji,Shimoina,Nagano | 600 | 543 |
| 3 |
|
Higashiosaka,Osaka | 510,000 | 752 |
| 3 |
|
Chuo,Osaka,Osaka | 510,000 | 759 |
| 3 |
|
Toyota,Aichi | 430,000 | 609 |
| 3 |
|
Amagasaki,Hyogo | 410,000 | 764 |
| 3 |
|
Yokkaichi,Mie | 300,000 | 657 |
| 3 |
|
Yao,Osaka | 260,000 | 755 |
| 3 |
|
Suzuka,Mie | 170,000 | 665 |
| 3 |
|
Hirano,Osaka,Osaka | 170,000 | 760 |
| 3 |
|
Midori,Nagoya,Aichi | 160,000 | 625 |
| 3 |
|
Moriguchi,Osaka | 140,000 | 752 |
| 3 |
|
Kadoma,Osaka | 130,000 | 750 |
| 3 |
|
Kusatsu,Shiga | 130,000 | 705 |
| 3 |
|
Seto,Aichi | 120,000 | 606 |
| 3 |
|
Higashisumiyoshi,Osaka,Osaka | 120,000 | 761 |
| 3 |
|
Nishinari,Osaka,Osaka | 110,000 | 763 |
| 3 |
|
Abeno,Osaka,Osaka | 110,000 | 761 |
| 3 |
|
Atsubetsu,Sapporo,Hokkaido | 110,000 | 560 |
| 3 |
|
Higashiomi,Shiga | 110,000 | 680 |
| 3 |
|
Nishio,Aichi | 110,000 | 631 |
| 3 |
|
Nishiyodogawa,Osaka,Osaka | 94,000 | 762 |
| 3 |
|
Naniwa,Osaka,Osaka | 91,000 | 761 |
| 3 |
|
Settsu,Osaka | 89,000 | 750 |
| 3 |
|
Yamatokoriyama,Nara | 89,000 | 740 |
| 3 |
|
Fukushima,Osaka,Osaka | 86,000 | 762 |
| 3 |
|
Minato,Osaka,Osaka | 83,000 | 764 |
| 3 |
|
Shiojiri,Nagano | 63,000 | 487 |
| 3 |
|
Nanao,Ishikawa | 61,000 | 532 |
| 3 |
|
Chita,Aichi | 58,000 | 637 |
| 3 |
|
Yawata,Kyoto | 57,000 | 732 |
| 3 |
|
Tokoname,Aichi | 53,000 | 646 |
| 3 |
|
Iwakura,Aichi | 36,000 | 619 |
| 3 |
|
Nemuro,Hokkaido | 31,000 | 624 |
| 3 |
|
Shimoda,Shizuoka | 28,000 | 517 |
| 3 |
|
Yoshida,Haibara,Shizuoka | 28,000 | 554 |
| 3 |
|
Fukagawa,Hokkaido | 26,000 | 628 |
| 3 |
|
Ginan,Hashima,Gifu | 25,000 | 619 |
| 3 |
|
Furano,Hokkaido | 25,000 | 583 |
| 3 |
|
Kira,Hazu,Aichi | 21,000 | 634 |
| 3 |
|
Isshiki,Hazu,Aichi | 20,000 | 636 |
| 3 |
|
Toyoyama,Nishikasugai,Aichi | 18,000 | 617 |
| 3 |
|
Setana,Kudo,Hokkaido | 11,000 | 541 |
| 3 |
|
Minamiizu,Kamo,Shizuoka | 9,200 | 525 |
| 3 |
|
Kawanishi,Shiki,Nara | 9,100 | 745 |
| 3 |
|
Teshikaga,Kawakami,Hokkaido | 8,900 | 613 |
| 3 |
|
Yuni,Yubari,Hokkaido | 6,600 | 551 |
| 3 |
|
Torahime,Higashiazai,Shiga | 6,200 | 658 |
| 3 |
|
Kunneppu,Tokoro,Hokkaido | 5,800 | 629 |
| 3 |
|
Erimo,Horoizumi,Hokkaido | 5,700 | 435 |
| 3 |
|
Koshimizu,Shari,Hokkaido | 5,700 | 653 |
| 3 |
|
Miyake,Shiki,Nara | 5,200 | 746 |
| 3 |
|
Yubetsu,Mombetsu,Hokkaido | 5,100 | 683 |
| 3 |
|
Kijimadaira,Shimotakai,Nagano | 4,900 | 416 |
| 3 |
|
Kiyosato,Shari,Hokkaido | 4,800 | 653 |
| 3 |
|
Niseko,Abuta,Hokkaido | 4,500 | 553 |
| 3 |
|
Nammoku,Kanra,Gumma | 2,600 | 426 |
| 3 |
|
Makkari,Abuta,Hokkaido | 2,200 | 546 |
| 3 |
|
Akaigawa,Yoichi,Hokkaido | 1,500 | 579 |
| 3 |
|
Oshika,Shimoina,Nagano | 1,300 | 513 |
| 3 |
|
Kita,Osaka,Osaka | 480,000 | 758 |
| 3 |
|
Nara,Nara | 340,000 | 736 |
| 3 |
|
Yodogawa,Osaka,Osaka | 230,000 | 759 |
| 3 |
|
Nishi,Osaka,Osaka | 190,000 | 761 |
| 3 |
|
Toyokawa,Aichi | 150,000 | 610 |
| 3 |
|
Suminoe,Osaka,Osaka | 130,000 | 766 |
| 3 |
|
Minami,Sapporo,Hokkaido | 120,000 | 557 |
| 3 |
|
Mino,Osaka | 100,000 | 754 |
| 3 |
|
Hamakita,Hamamatsu,Shizuoka | 76,000 | 583 |
| 3 |
|
Hekinan,Aichi | 70,000 | 634 |
| 3 |
|
Tahara,Aichi | 69,000 | 629 |
| 3 |
|
Joyo,Kyoto | 62,000 | 728 |
| 3 |
|
Kyotango,Kyoto | 61,000 | 746 |
| 3 |
|
Moriyama,Shiga | 60,000 | 700 |
| 3 |
|
Toki,Gifu | 55,000 | 591 |
| 3 |
|
Takashima,Shiga | 51,000 | 680 |
| 3 |
|
Itoigawa,Niigata | 48,000 | 455 |
| 3 |
|
Oguchi,Niwa,Aichi | 34,000 | 613 |
| 3 |
|
Tenryu,Hamamatsu,Shizuoka | 33,000 | 576 |
| 3 |
|
Komono,Mie,Mie | 32,000 | 662 |
| 3 |
|
Namerikawa,Toyama | 31,000 | 509 |
| 3 |
|
Yoro,Yoro,Gifu | 27,000 | 641 |
| 3 |
|
Nanae,Kameda,Hokkaido | 24,000 | 459 |
| 3 |
|
Hakui,Ishikawa | 24,000 | 552 |
| 3 |
|
Bihoro,Abashiri,Hokkaido | 21,000 | 644 |
| 3 |
|
Aisho,Echi,Shiga | 20,000 | 676 |
| 3 |
|
Godo,Ampachi,Gifu | 17,000 | 631 |
| 3 |
|
Hombetsu,Nakagawa,Hokkaido | 9,000 | 561 |
| 3 |
|
Hachijo,Hachijojima,Tokyo | 8,800 | 620 |
| 3 |
|
Kawanehon,Haibara,Shizuoka | 8,600 | 545 |
| 3 |
|
Hiro,Hiro,Hokkaido | 8,100 | 466 |
| 3 |
|
Matsukawa,Kitaazumi,Nagano | 7,700 | 480 |
| 3 |
|
Naie,Sorachi,Hokkaido | 7,300 | 597 |
| 3 |
|
Ando,Ikoma,Nara | 6,200 | 745 |
| 3 |
|
Tsukigata,Kabato,Hokkaido | 5,200 | 590 |
| 3 |
|
Okuwa,Kiso,Nagano | 4,300 | 534 |
| 3 |
|
Chikuhoku,Higashichikuma,Nagano | 4,300 | 467 |
| 3 |
|
Otobe,Nishi,Hokkaido | 4,200 | 487 |
| 3 |
|
Kembuchi,Kamikawa,Hokkaido | 3,800 | 667 |
| 3 |
|
Uryu,Uryu,Hokkaido | 3,400 | 621 |
| 3 |
|
Shimukappu,Yufutsu,Hokkaido | 1,500 | 543 |
| 3 |
|
Neba,Shimoina,Nagano | 1,200 | 567 |
| 3 |
|
Mikurajima,Tokyo | 310 | 552 |
| 3 |
|
Chuo,Sapporo,Hokkaido | 390,000 | 565 |
| 3 |
|
Hirakata,Osaka | 330,000 | 740 |
| 3 |
|
Toyonaka,Osaka | 320,000 | 756 |
| 3 |
|
Otsu,Shiga | 300,000 | 713 |
| 3 |
|
Fukui,Fukui | 290,000 | 630 |
| 3 |
|
Tsu,Mie | 290,000 | 681 |
| 3 |
|
Takatsuki,Osaka | 280,000 | 741 |
| 3 |
|
Sakai,Sakai,Osaka | 170,000 | 768 |
| 3 |
|
Higashiyodogawa,Osaka,Osaka | 140,000 | 754 |
| 3 |
|
Kakamigahara,Gifu | 130,000 | 614 |
| 3 |
|
Kuwana,Mie | 120,000 | 646 |
| 3 |
|
Naka,Sakai,Osaka | 100,000 | 769 |
| 3 |
|
Miyakojima,Osaka,Osaka | 100,000 | 757 |
| 3 |
|
Shimada,Shizuoka | 91,000 | 554 |
| 3 |
|
Imizu,Toyama | 89,000 | 531 |
| 3 |
|
Asahi,Osaka,Osaka | 86,000 | 754 |
| 3 |
|
Tenri,Nara | 74,000 | 739 |
| 3 |
|
Fujiidera,Osaka | 56,000 | 759 |
| 3 |
|
Konan,Shiga | 52,000 | 696 |
| 3 |
|
Inabe,Mie | 46,000 | 652 |
| 3 |
|
Noboribetsu,Hokkaido | 46,000 | 501 |
| 3 |
|
Gero,Gifu | 38,000 | 560 |
| 3 |
|
Kumiyama,Kuse,Kyoto | 33,000 | 730 |
| 3 |
|
Ashibetsu,Hokkaido | 18,000 | 604 |
| 3 |
|
Mori,Shuchi,Shizuoka | 18,000 | 571 |
| 3 |
|
Arai,Hamana,Shizuoka | 16,000 | 607 |
| 3 |
|
Wakasa,Mikatakaminaka,Fukui | 15,000 | 680 |
| 3 |
|
Shari,Shari,Hokkaido | 14,000 | 663 |
| 3 |
|
Mikasa,Hokkaido | 12,000 | 577 |
| 3 |
|
Hata,Higashichikuma,Nagano | 11,000 | 491 |
| 3 |
|
Ikeda,Kitaazumi,Nagano | 9,600 | 479 |
| 3 |
|
Obuse,Kamitakai,Nagano | 9,400 | 430 |
| 3 |
|
Kinomoto,Ika,Shiga | 8,400 | 657 |
| 3 |
|
Oshamambe,Yamakoshi,Hokkaido | 6,900 | 533 |
| 3 |
|
Nagawa,Chiisagata,Nagano | 6,200 | 455 |
| 3 |
|
Kisosaki,Kuwana,Mie | 5,700 | 642 |
| 3 |
|
Fukushima,Matsumae,Hokkaido | 5,400 | 436 |
| 3 |
|
Shikabe,Kayabe,Hokkaido | 4,800 | 470 |
| 3 |
|
Aoki,Chiisagata,Nagano | 4,200 | 460 |
| 3 |
|
Omi,Higashichikuma,Nagano | 2,900 | 463 |
| 3 |
|
Rikubetsu,Ashoro,Hokkaido | 2,900 | 601 |
| 3 |
|
Kiso-mura,Kiso,Nagano | 2,800 | 511 |
| 3 |
|
Ogawa,Kamiminochi,Nagano | 2,700 | 462 |
| 3 |
|
Rusutsu,Abuta,Hokkaido | 2,300 | 541 |
| 3 |
|
Kazamaura,Shimokita,Aomori | 2,200 | 408 |
| 3 |
|
Otaki,Kiso,Nagano | 1,100 | 536 |
| 3 |
|
Toyama,Toyama | 450,000 | 522 |
| 3 |
|
Toyohira,Sapporo,Hokkaido | 170,000 | 561 |
| 3 |
|
Sumiyoshi,Osaka,Osaka | 140,000 | 765 |
| 3 |
|
Tennoji,Osaka,Osaka | 130,000 | 760 |
| 3 |
|
Kita,Sakai,Osaka | 120,000 | 766 |
| 3 |
|
Matsubara,Osaka | 120,000 | 762 |
| 3 |
|
Tajimi,Gifu | 96,000 | 596 |
| 3 |
|
Konan,Aichi | 81,000 | 616 |
| 3 |
|
Ritto,Shiga | 63,000 | 701 |
| 3 |
|
Katano,Osaka | 59,000 | 740 |
| 3 |
|
Suzaka,Nagano | 52,000 | 433 |
| 3 |
|
Minokamo,Gifu | 51,000 | 598 |
| 3 |
|
Motosu,Gifu | 37,000 | 622 |
| 3 |
|
Oyabe,Toyama | 30,000 | 552 |
| 3 |
|
Engaru,Mombetsu,Hokkaido | 23,000 | 664 |
| 3 |
|
Shika,Hakui,Ishikawa | 22,000 | 549 |
| 3 |
|
Tateyama,Nakaniikawa,Toyama | 22,000 | 515 |
| 3 |
|
Uchinada,Kahoku,Ishikawa | 19,000 | 572 |
| 3 |
|
Tadaoka,Semboku,Osaka | 17,000 | 779 |
| 3 |
|
Kawagoe,Mie,Mie | 14,000 | 649 |
| 3 |
|
Biei,Kamikawa,Hokkaido | 11,000 | 610 |
| 3 |
|
Esashi,Hiyama,Hokkaido | 10,000 | 478 |
| 3 |
|
Kohoku,Higashiazai,Shiga | 7,200 | 659 |
| 3 |
|
Shitara,Kitashitara,Aichi | 6,300 | 578 |
| 3 |
|
Nozawaonsen,Shimotakai,Nagano | 4,200 | 411 |
| 3 |
|
Nishiazai,Ika,Shiga | 3,600 | 665 |
| 3 |
|
Sarufutsu,Soya,Hokkaido | 2,900 | 805 |
| 3 |
|
Urausu,Kabato,Hokkaido | 2,300 | 598 |
| 3 |
|
Ikusaka,Higashichikuma,Nagano | 1,800 | 474 |
| 3 |
|
Awashimaura,Iwafune,Niigata | 520 | 317 |
| 3 |
|
Kanazawa,Ishikawa | 490,000 | 574 |
| 3 |
|
Asahikawa,Hokkaido | 340,000 | 631 |
| 3 |
|
Kishiwada,Osaka | 180,000 | 783 |
| 3 |
|
Nishi,Sapporo,Hokkaido | 170,000 | 567 |
| 3 |
|
Nishi,Sakai,Osaka | 120,000 | 772 |
| 3 |
|
Habikino,Osaka | 97,000 | 759 |
| 3 |
|
Kani,Gifu | 89,000 | 596 |
| 3 |
|
Izumiotsu,Osaka | 71,000 | 778 |
| 3 |
|
Tsuruga,Fukui | 68,000 | 663 |
| 3 |
|
Nagaokakyo,Kyoto | 68,000 | 730 |
| 3 |
|
Obama,Fukui | 32,000 | 696 |
| 3 |
|
Harima,Kako,Hyogo | 28,000 | 807 |
| 3 |
|
Fuso,Niwa,Aichi | 27,000 | 611 |
| 3 |
|
Yamagata,Gifu | 24,000 | 613 |
| 3 |
|
Yakumo,Futami,Hokkaido | 19,000 | 511 |
| 3 |
|
Kitagata,Motosu,Gifu | 14,000 | 624 |
| 3 |
|
Akabira,Hokkaido | 14,000 | 610 |
| 3 |
|
Yubari,Hokkaido | 13,000 | 555 |
| 3 |
|
Kamifurano,Sorachi,Hokkaido | 13,000 | 595 |
| 3 |
|
Toyosato,Inukami,Shiga | 7,200 | 673 |
| 3 |
|
Toma,Kamikawa,Hokkaido | 7,000 | 636 |
| 3 |
|
Oketo,Tokoro,Hokkaido | 3,500 | 622 |
| 3 |
|
Okushiri,Okushiri,Hokkaido | 3,300 | 533 |
| 3 |
|
Minamifurano,Sorachi,Hokkaido | 2,900 | 562 |
| 3 |
|
Funahashi,Nakaniikawa,Toyama | 1,900 | 514 |
| 3 |
|
Urugi,Shimoina,Nagano | 790 | 556 |
| 3 |
|
Aogashima,Tokyo | 240 | 687 |
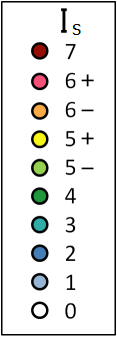
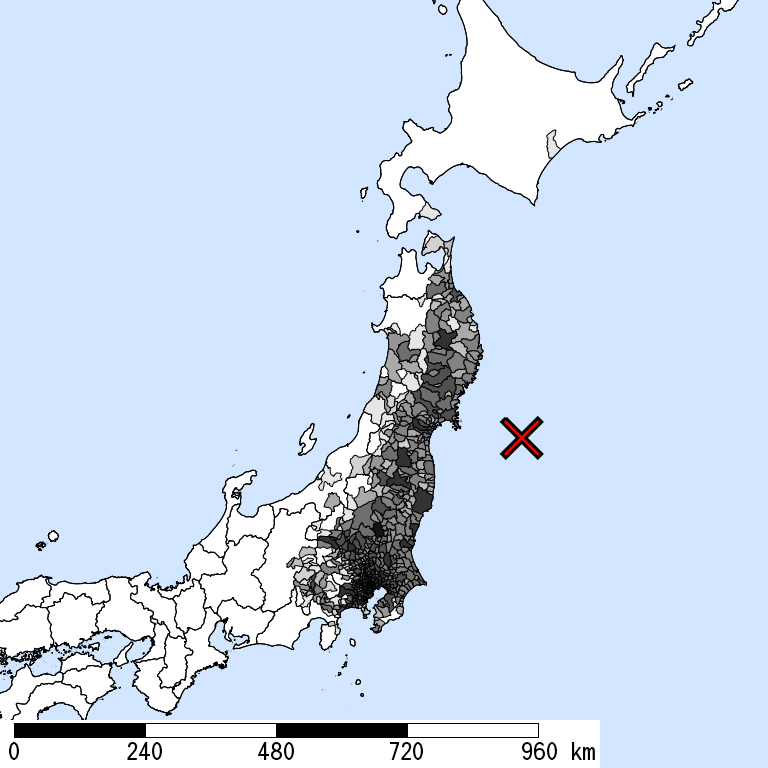
The histogram shows frequency distribution of estimated Is derived from interpolation of the observation with 250-m mesh. The daytime and nighttime correspond to 9:00-18:59 and 19:00-8:59, respectively. The distance is measured from the epicenter to the center of the municipality.
Is Exposed-Population Estimates of Each City
5- or greater
|
5+ or greater
|
6- or greater
|
6+ or greater
|

| Show All Data | ||||
| 5- or greater |
5+ or greater |
6- or greater |
6+ or greater |
|
| Whole of Japan | 50,000,000 | 20,000,000 | 5,000,000 | 1,000,000 |
| Hokkaido Prefecture | < 1,000 | |||
| Hakodate,Hokkaido | < 1,000 | |||
| Urahoro,Tokachi,Hokkaido | < 1,000 | |||
| Aomori Prefecture | 500,000 | 20,000 | 2,000 | |
| Hachinohe,Aomori | 200,000 | 10,000 | < 1,000 | |
| Towada,Aomori | 50,000 | < 1,000 | ||
| Misawa,Aomori | 20,000 | |||
| Mutsu,Aomori | 2,000 | |||
| Noheji,Kamikita,Aomori | 2,000 | |||
| Shichinohe,Kamikita,Aomori | 10,000 | < 1,000 | ||
| Rokunohe,Kamikita,Aomori | 10,000 | |||
| Tohoku,Kamikita,Aomori | 10,000 | 5,000 | ||
| Rokkasho,Kamikita,Aomori | < 1,000 | |||
| Oirase,Kamikita,Aomori | 20,000 | 5,000 | ||
| Higashidori,Shimokita,Aomori | 2,000 | 1,000 | ||
| Sannohe,Sannohe,Aomori | 5,000 | |||
| Gonohe,Sannohe,Aomori | 20,000 | < 1,000 | ||
| Takko,Sannohe,Aomori | 5,000 | |||
| Nambu,Sannohe,Aomori | 10,000 | |||
| Hashikami,Sannohe,Aomori | 10,000 | 10,000 | 2,000 | |
| Shingo,Sannohe,Aomori | 1,000 | < 1,000 | ||
| Iwate Prefecture | 1,000,000 | 1,000,000 | 200,000 | 20,000 |
| Morioka,Iwate | 200,000 | 200,000 | 10,000 | |
| Miyako,Iwate | 50,000 | 5,000 | ||
| Ofunato,Iwate | 50,000 | 50,000 | 20,000 | 5,000 |
| Hanamaki,Iwate | 100,000 | 100,000 | < 1,000 | |
| Kitakami,Iwate | 100,000 | 100,000 | 50,000 | < 1,000 |
| Kuji,Iwate | 20,000 | < 1,000 | ||
| Tono,Iwate | 20,000 | 10,000 | ||
| Ichinoseki,Iwate | 100,000 | 100,000 | 100,000 | 10,000 |
| Rikuzentakata,Iwate | 20,000 | 20,000 | 20,000 | 5,000 |
| Kamaishi,Iwate | 50,000 | 50,000 | 20,000 | 5,000 |
| Ninohe,Iwate | 20,000 | < 1,000 | ||
| Hachimantai,Iwate | 20,000 | 20,000 | < 1,000 | |
| Oshu,Iwate | 100,000 | 100,000 | 10,000 | |
| Shizukuishi,Iwate,Iwate | 20,000 | 2,000 | ||
| Kuzumaki,Iwate,Iwate | < 1,000 | < 1,000 | ||
| Iwate,Iwate,Iwate | 10,000 | 2,000 | < 1,000 | |
| Takizawa,Iwate,Iwate | 50,000 | 50,000 | 20,000 | |
| Shiwa,Shiwa,Iwate | 20,000 | 20,000 | < 1,000 | |
| Yahaba,Shiwa,Iwate | 20,000 | 20,000 | 20,000 | |
| Nishiwaga,Waga,Iwate | < 1,000 | |||
| Kanegasaki,Isawa,Iwate | 20,000 | 20,000 | < 1,000 | |
| Hiraizumi,Nishiiwai,Iwate | 10,000 | 10,000 | 2,000 | |
| Fujisawa,Higashiiwai,Iwate | 10,000 | 10,000 | 5,000 | |
| Sumita,Kesen,Iwate | 5,000 | 2,000 | ||
| Otsuchi,Kamihei,Iwate | 20,000 | 10,000 | 10,000 | |
| Yamada,Shimohei,Iwate | 10,000 | 5,000 | ||
| Iwaizumi,Shimohei,Iwate | 5,000 | 1,000 | ||
| Tanohata,Shimohei,Iwate | < 1,000 | |||
| Fudai,Shimohei,Iwate | 2,000 | < 1,000 | ||
| Kawai,Shimohei,Iwate | 2,000 | < 1,000 | ||
| Karumai,Kunohe,Iwate | 5,000 | < 1,000 | ||
| Noda,Kunohe,Iwate | 2,000 | < 1,000 | ||
| Kunohe,Kunohe,Iwate | 5,000 | 1,000 | ||
| Hirono,Kunohe,Iwate | 10,000 | 1,000 | ||
| Ichinohe,Ninohe,Iwate | 20,000 | 5,000 | ||
| Miyagi Prefecture | 2,000,000 | 2,000,000 | 2,000,000 | 500,000 |
| Aoba,Sendai,Miyagi | 500,000 | 500,000 | 200,000 | |
| Miyagino,Sendai,Miyagi | 200,000 | 200,000 | 200,000 | 100,000 |
| Wakabayashi,Sendai,Miyagi | 200,000 | 200,000 | 200,000 | 50,000 |
| Taihaku,Sendai,Miyagi | 200,000 | 200,000 | 100,000 | 50,000 |
| Izumi,Sendai,Miyagi | 200,000 | 200,000 | 200,000 | 20,000 |
| Ishinomaki,Miyagi | 200,000 | 200,000 | 100,000 | 20,000 |
| Shiogama,Miyagi | 50,000 | 50,000 | 50,000 | 10,000 |
| Kesennuma,Miyagi | 50,000 | 50,000 | 50,000 | 5,000 |
| Shiroishi,Miyagi | 50,000 | 50,000 | 20,000 | < 1,000 |
| Natori,Miyagi | 50,000 | 50,000 | 50,000 | 20,000 |
| Kakuda,Miyagi | 20,000 | 20,000 | 20,000 | 1,000 |
| Tagajo,Miyagi | 50,000 | 50,000 | 50,000 | 5,000 |
| Iwanuma,Miyagi | 50,000 | 50,000 | 50,000 | |
| Tome,Miyagi | 100,000 | 100,000 | 100,000 | 20,000 |
| Kurihara,Miyagi | 100,000 | 100,000 | 50,000 | 50,000 |
| Higashimatsushima,Miyagi | 50,000 | 50,000 | 50,000 | 20,000 |
| Osaki,Miyagi | 100,000 | 100,000 | 100,000 | 100,000 |
| Zao,Katta,Miyagi | 10,000 | 10,000 | 10,000 | 2,000 |
| Shichikashuku,Katta,Miyagi | 2,000 | 1,000 | < 1,000 | |
| Ogawara,Shibata,Miyagi | 20,000 | 20,000 | 20,000 | |
| Murata,Shibata,Miyagi | 10,000 | 10,000 | 5,000 | < 1,000 |
| Shibata,Shibata,Miyagi | 50,000 | 50,000 | 20,000 | |
| Kawasaki,Shibata,Miyagi | 10,000 | 10,000 | 10,000 | 10,000 |
| Marumori,Igu,Miyagi | 10,000 | 10,000 | 5,000 | < 1,000 |
| Watari,Watari,Miyagi | 20,000 | 20,000 | 20,000 | 2,000 |
| Yamamoto,Watari,Miyagi | 20,000 | 20,000 | 20,000 | 10,000 |
| Matsushima,Miyagi,Miyagi | 10,000 | 10,000 | 10,000 | < 1,000 |
| Shichigahama,Miyagi,Miyagi | 10,000 | 10,000 | 10,000 | < 1,000 |
| Rifu,Miyagi,Miyagi | 20,000 | 20,000 | 10,000 | |
| Taiwa,Kurokawa,Miyagi | 20,000 | 20,000 | 20,000 | 5,000 |
| Osato,Kurokawa,Miyagi | 10,000 | 10,000 | 10,000 | 1,000 |
| Tomiya,Kurokawa,Miyagi | 20,000 | 20,000 | 20,000 | < 1,000 |
| Ohira,Kurokawa,Miyagi | 10,000 | 10,000 | 10,000 | < 1,000 |
| Shikama,Kami,Miyagi | 10,000 | 10,000 | 1,000 | |
| Kami,Kami,Miyagi | 20,000 | 20,000 | 10,000 | < 1,000 |
| Wakuya,Toda,Miyagi | 20,000 | 20,000 | 20,000 | 10,000 |
| Misato,Toda,Miyagi | 20,000 | 20,000 | 20,000 | 20,000 |
| Onagawa,Oshika,Miyagi | 10,000 | 5,000 | < 1,000 | |
| Motoyoshi,Motoyoshi,Miyagi | 10,000 | 10,000 | 2,000 | |
| Minamisanriku,Motoyoshi,Miyagi | 20,000 | 20,000 | 10,000 | |
| Akita Prefecture | 100,000 | 20,000 | < 1,000 | |
| Akita,Akita | 20,000 | 5,000 | ||
| Yokote,Akita | 5,000 | 1,000 | ||
| Yuzawa,Akita | 1,000 | |||
| Yurihonjo,Akita | 5,000 | |||
| Katagami,Akita | < 1,000 | |||
| Daisen,Akita | 50,000 | 20,000 | ||
| Semboku,Akita | < 1,000 | |||
| Kosaka,Kazuno,Akita | < 1,000 | < 1,000 | ||
| Gojome,Minamiakita,Akita | < 1,000 | |||
| Ikawa,Minamiakita,Akita | 2,000 | |||
| Misato,Semboku,Akita | 10,000 | < 1,000 | ||
| Higashinaruse,Ogachi,Akita | 1,000 | < 1,000 | < 1,000 | |
| Yamagata Prefecture | 500,000 | 100,000 | < 1,000 | |
| Yamagata,Yamagata | 50,000 | 20,000 | < 1,000 | |
| Yonezawa,Yamagata | 100,000 | 20,000 | ||
| Tsuruoka,Yamagata | < 1,000 | |||
| Sakata,Yamagata | 20,000 | < 1,000 | ||
| Shinjo,Yamagata | 1,000 | |||
| Sagae,Yamagata | 10,000 | 10,000 | ||
| Kaminoyama,Yamagata | 20,000 | 10,000 | ||
| Murayama,Yamagata | 20,000 | 5,000 | ||
| Nagai,Yamagata | < 1,000 | |||
| Tendo,Yamagata | 50,000 | 5,000 | ||
| Higashine,Yamagata | 50,000 | 1,000 | ||
| Obanazawa,Yamagata | 20,000 | 5,000 | ||
| Nanyo,Yamagata | 20,000 | < 1,000 | ||
| Yamanobe,Higashimurayama,Yamagata | 10,000 | 2,000 | ||
| Nakayama,Higashimurayama,Yamagata | 10,000 | 10,000 | ||
| Kahoku,Nishimurayama,Yamagata | 20,000 | < 1,000 | ||
| Nishikawa,Nishimurayama,Yamagata | < 1,000 | |||
| Asahi,Nishimurayama,Yamagata | < 1,000 | |||
| Oe,Nishimurayama,Yamagata | < 1,000 | |||
| Oishida,Kitamurayama,Yamagata | 10,000 | < 1,000 | ||
| Mogami,Mogami,Yamagata | 10,000 | < 1,000 | ||
| Funagata,Mogami,Yamagata | 2,000 | |||
| Okura,Mogami,Yamagata | 2,000 | |||
| Tozawa,Mogami,Yamagata | 2,000 | |||
| Takahata,Higashiokitama,Yamagata | 20,000 | 1,000 | ||
| Kawanishi,Higashiokitama,Yamagata | 10,000 | < 1,000 | ||
| Shirataka,Nishiokitama,Yamagata | 10,000 | < 1,000 | ||
| Iide,Nishiokitama,Yamagata | < 1,000 | |||
| Mikawa,Higashitagawa,Yamagata | 1,000 | |||
| Shonai,Higashitagawa,Yamagata | 10,000 | < 1,000 | ||
| Yuza,Akumi,Yamagata | 10,000 | |||
| Fukushima Prefecture | 2,000,000 | 2,000,000 | 1,000,000 | 200,000 |
| Fukushima,Fukushima | 200,000 | 200,000 | 20,000 | |
| Aizuwakamatsu,Fukushima | 100,000 | 100,000 | 10,000 | |
| Koriyama,Fukushima | 500,000 | 500,000 | 200,000 | 20,000 |
| Iwaki,Fukushima | 500,000 | 500,000 | 200,000 | 50,000 |
| Shirakawa,Fukushima | 50,000 | 50,000 | 50,000 | 10,000 |
| Sukagawa,Fukushima | 100,000 | 100,000 | 100,000 | 5,000 |
| Kitakata,Fukushima | 20,000 | 5,000 | 1,000 | |
| Soma,Fukushima | 50,000 | 50,000 | 20,000 | < 1,000 |
| Nihommatsu,Fukushima | 50,000 | 50,000 | 20,000 | < 1,000 |
| Tamura,Fukushima | 50,000 | 50,000 | 20,000 | 1,000 |
| Minamisoma,Fukushima | 50,000 | 50,000 | 50,000 | 2,000 |
| Date,Fukushima | 50,000 | 50,000 | 20,000 | < 1,000 |
| Motomiya,Fukushima | 20,000 | 20,000 | 2,000 | < 1,000 |
| Kori,Date,Fukushima | 10,000 | 10,000 | 10,000 | 2,000 |
| Kunimi,Date,Fukushima | 10,000 | 10,000 | 10,000 | 10,000 |
| Kawamata,Date,Fukushima | 20,000 | 20,000 | < 1,000 | |
| Otama,Adachi,Fukushima | 5,000 | 5,000 | < 1,000 | |
| Kagamiishi,Iwase,Fukushima | 10,000 | 10,000 | 10,000 | |
| Tenei,Iwase,Fukushima | 5,000 | 5,000 | 5,000 | 1,000 |
| Shimogo,Minamiaizu,Fukushima | 5,000 | < 1,000 | ||
| Hinoemata,Minamiaizu,Fukushima | < 1,000 | |||
| Minamiaizu,Minamiaizu,Fukushima | 5,000 | |||
| Kitashiobara,Yama,Fukushima | 2,000 | 1,000 | ||
| Nishiaizu,Yama,Fukushima | 5,000 | |||
| Bandai,Yama,Fukushima | 5,000 | 5,000 | ||
| Inawashiro,Yama,Fukushima | 20,000 | 10,000 | ||
| Aizubange,Kawanuma,Fukushima | 20,000 | 20,000 | 2,000 | |
| Yugawa,Kawanuma,Fukushima | 5,000 | 5,000 | 1,000 | |
| Yanaizu,Kawanuma,Fukushima | 1,000 | |||
| Aizumisato,Onuma,Fukushima | 20,000 | 2,000 | ||
| Nishigo,Nishishirakawa,Fukushima | 20,000 | 20,000 | 20,000 | 2,000 |
| Izumizaki,Nishishirakawa,Fukushima | 10,000 | 10,000 | 2,000 | |
| Nakajima,Nishishirakawa,Fukushima | 5,000 | 5,000 | 5,000 | |
| Yabuki,Nishishirakawa,Fukushima | 20,000 | 20,000 | 20,000 | |
| Tanagura,Higashishirakawa,Fukushima | 20,000 | 20,000 | 5,000 | |
| Yamatsuri,Higashishirakawa,Fukushima | 5,000 | 2,000 | ||
| Hanawa,Higashishirakawa,Fukushima | 10,000 | 2,000 | ||
| Samegawa,Higashishirakawa,Fukushima | 5,000 | < 1,000 | ||
| Ishikawa,Ishikawa,Fukushima | 20,000 | 20,000 | 2,000 | |
| Tamakawa,Ishikawa,Fukushima | 5,000 | 5,000 | 5,000 | |
| Hirata,Ishikawa,Fukushima | 5,000 | 5,000 | < 1,000 | |
| Asakawa,Ishikawa,Fukushima | 5,000 | 5,000 | 5,000 | |
| Furudono,Ishikawa,Fukushima | 5,000 | 5,000 | < 1,000 | |
| Miharu,Tamura,Fukushima | 20,000 | 20,000 | 2,000 | < 1,000 |
| Ono,Tamura,Fukushima | 10,000 | 10,000 | 5,000 | |
| Hirono,Futaba,Fukushima | 5,000 | 5,000 | 2,000 | |
| Naraha,Futaba,Fukushima | 10,000 | 10,000 | 10,000 | 2,000 |
| Tomioka,Futaba,Fukushima | 20,000 | 20,000 | 20,000 | 10,000 |
| Kawauchi,Futaba,Fukushima | 2,000 | 2,000 | 2,000 | < 1,000 |
| Okuma,Futaba,Fukushima | 10,000 | 10,000 | 10,000 | 10,000 |
| Futaba,Futaba,Fukushima | 5,000 | 5,000 | 5,000 | 5,000 |
| Namie,Futaba,Fukushima | 20,000 | 20,000 | 20,000 | 10,000 |
| Katsurao,Futaba,Fukushima | 1,000 | 1,000 | 1,000 | < 1,000 |
| Shinchi,Soma,Fukushima | 10,000 | 10,000 | 10,000 | 2,000 |
| Iitate,Soma,Fukushima | 5,000 | 5,000 | 2,000 | |
| Ibaraki Prefecture | 2,000,000 | 2,000,000 | 2,000,000 | 200,000 |
| Mito,Ibaraki | 200,000 | 200,000 | 200,000 | 20,000 |
| Hitachi,Ibaraki | 200,000 | 200,000 | 200,000 | 200,000 |
| Tsuchiura,Ibaraki | 200,000 | 200,000 | 200,000 | 20,000 |
| Koga,Ibaraki | 100,000 | 50,000 | ||
| Ishioka,Ibaraki | 100,000 | 100,000 | 50,000 | < 1,000 |
| Yuki,Ibaraki | 50,000 | 50,000 | 10,000 | |
| Ryugasaki,Ibaraki | 50,000 | 50,000 | < 1,000 | |
| Shimotsuma,Ibaraki | 50,000 | 50,000 | 10,000 | < 1,000 |
| Joso,Ibaraki | 50,000 | 50,000 | 5,000 | |
| Hitachiota,Ibaraki | 50,000 | 50,000 | 50,000 | 20,000 |
| Takahagi,Ibaraki | 20,000 | 20,000 | 20,000 | 5,000 |
| Kitaibaraki,Ibaraki | 50,000 | 50,000 | 50,000 | 10,000 |
| Kasama,Ibaraki | 100,000 | 100,000 | 50,000 | 5,000 |
| Toride,Ibaraki | 100,000 | 100,000 | 50,000 | 1,000 |
| Ushiku,Ibaraki | 50,000 | 50,000 | < 1,000 | |
| Tsukuba,Ibaraki | 200,000 | 200,000 | 200,000 | |
| Hitachinaka,Ibaraki | 200,000 | 200,000 | 200,000 | 5,000 |
| Kashima,Ibaraki | 50,000 | 50,000 | 50,000 | 1,000 |
| Itako,Ibaraki | 20,000 | 20,000 | 20,000 | |
| Moriya,Ibaraki | 50,000 | 50,000 | < 1,000 | |
| Hitachiomiya,Ibaraki | 50,000 | 50,000 | 50,000 | 5,000 |
| Naka,Ibaraki | 50,000 | 50,000 | 50,000 | 10,000 |
| Chikusei,Ibaraki | 100,000 | 100,000 | 50,000 | 2,000 |
| Bando,Ibaraki | 50,000 | 50,000 | 1,000 | |
| Inashiki,Ibaraki | 50,000 | 50,000 | 10,000 | |
| Kasumigaura,Ibaraki | 50,000 | 50,000 | 20,000 | |
| Sakuragawa,Ibaraki | 50,000 | 50,000 | 20,000 | 5,000 |
| Kamisu,Ibaraki | 100,000 | 50,000 | 5,000 | |
| Namegata,Ibaraki | 50,000 | 50,000 | 20,000 | 5,000 |
| Hokota,Ibaraki | 50,000 | 50,000 | 50,000 | 10,000 |
| Tsukubamirai,Ibaraki | 50,000 | 50,000 | 10,000 | |
| Omitama,Ibaraki | 50,000 | 50,000 | 50,000 | 5,000 |
| Ibaraki,Higashiibaraki,Ibaraki | 20,000 | 20,000 | 20,000 | |
| Oarai,Higashiibaraki,Ibaraki | 20,000 | 20,000 | 2,000 | |
| Shirosato,Higashiibaraki,Ibaraki | 20,000 | 20,000 | 10,000 | 1,000 |
| Tokai,Naka,Ibaraki | 50,000 | 50,000 | 50,000 | < 1,000 |
| Daigo,Kuji,Ibaraki | 20,000 | 20,000 | 5,000 | |
| Miho,Inashiki,Ibaraki | 20,000 | 20,000 | 10,000 | |
| Ami,Inashiki,Ibaraki | 50,000 | 50,000 | 10,000 | |
| Kawachi,Inashiki,Ibaraki | 10,000 | 5,000 | 5,000 | |
| Yachiyo,Yuki,Ibaraki | 20,000 | 20,000 | 2,000 | |
| Goka,Sashima,Ibaraki | 10,000 | 10,000 | ||
| Sakai,Sashima,Ibaraki | 20,000 | 20,000 | ||
| Tone,Kitasoma,Ibaraki | 10,000 | 10,000 | < 1,000 | |
| Tochigi Prefecture | 2,000,000 | 1,000,000 | 500,000 | 100,000 |
| Utsunomiya,Tochigi | 500,000 | 200,000 | 50,000 | 20,000 |
| Ashikaga,Tochigi | 100,000 | 100,000 | 5,000 | |
| Tochigi,Tochigi | 50,000 | |||
| Sano,Tochigi | 100,000 | 50,000 | ||
| Kanuma,Tochigi | 100,000 | 50,000 | < 1,000 | |
| Nikko,Tochigi | 100,000 | 50,000 | 20,000 | 2,000 |
| Oyama,Tochigi | 200,000 | 200,000 | < 1,000 | |
| Moka,Tochigi | 50,000 | 50,000 | 50,000 | < 1,000 |
| Otawara,Tochigi | 100,000 | 100,000 | 50,000 | 5,000 |
| Yaita,Tochigi | 50,000 | 20,000 | ||
| Nasushiobara,Tochigi | 100,000 | 100,000 | 20,000 | |
| Sakura,Tochigi | 50,000 | 50,000 | 10,000 | |
| Nasukarasuyama,Tochigi | 20,000 | 20,000 | 10,000 | 1,000 |
| Shimotsuke,Tochigi | 50,000 | 50,000 | ||
| Kaminokawa,Kawachi,Tochigi | 50,000 | 20,000 | ||
| Nishikata,Kamitsuga,Tochigi | 5,000 | |||
| Ninomiya,Haga,Tochigi | 10,000 | 10,000 | 10,000 | 2,000 |
| Mashiko,Haga,Tochigi | 20,000 | 20,000 | 10,000 | < 1,000 |
| Motegi,Haga,Tochigi | 10,000 | 10,000 | 10,000 | 1,000 |
| Ichikai,Haga,Tochigi | 10,000 | 10,000 | 10,000 | 10,000 |
| Haga,Haga,Tochigi | 20,000 | 20,000 | 20,000 | 20,000 |
| Mibu,Shimotsuga,Tochigi | 50,000 | 1,000 | ||
| Nogi,Shimotsuga,Tochigi | 20,000 | 1,000 | ||
| Oohira,Shimotsuga,Tochigi | 20,000 | < 1,000 | ||
| Fujioka,Shimotsuga,Tochigi | 20,000 | 2,000 | ||
| Iwafune,Shimotsuga,Tochigi | 20,000 | < 1,000 | ||
| Tsuga,Shimotsuga,Tochigi | 10,000 | |||
| Shioya,Shioya,Tochigi | 10,000 | 5,000 | ||
| Takanezawa,Shioya,Tochigi | 20,000 | 20,000 | 20,000 | 20,000 |
| Nasu,Nasu,Tochigi | 20,000 | 20,000 | 20,000 | 1,000 |
| Nakagawa,Nasu,Tochigi | 20,000 | 20,000 | 20,000 | 5,000 |
| Gumma Prefecture | 1,000,000 | 200,000 | 5,000 | |
| Maebashi,Gumma | 100,000 | |||
| Takasaki,Gumma | 200,000 | 20,000 | ||
| Kiryu,Gumma | 100,000 | 50,000 | ||
| Isesaki,Gumma | 200,000 | 10,000 | ||
| Ota,Gumma | 200,000 | 100,000 | 2,000 | |
| Numata,Gumma | 20,000 | 1,000 | ||
| Tatebayashi,Gumma | 100,000 | 20,000 | < 1,000 | |
| Shibukawa,Gumma | 50,000 | 2,000 | ||
| Fujioka,Gumma | 5,000 | < 1,000 | ||
| Annaka,Gumma | 20,000 | |||
| Midori,Gumma | 50,000 | < 1,000 | ||
| Fujimi,Seta,Gumma | 10,000 | < 1,000 | ||
| Shinto,Kitagumma,Gumma | 1,000 | |||
| Yoshioka,Kitagumma,Gumma | 10,000 | |||
| Yoshii,Tano,Gumma | 5,000 | |||
| Kanna,Tano,Gumma | < 1,000 | |||
| Kusatsu,Agatsuma,Gumma | < 1,000 | |||
| Kuni,Agatsuma,Gumma | < 1,000 | |||
| Higashiagatsuma,Agatsuma,Gumma | < 1,000 | |||
| Katashina,Tone,Gumma | < 1,000 | |||
| Kawaba,Tone,Gumma | 2,000 | |||
| Showa,Tone,Gumma | 1,000 | |||
| Tamamura,Sawa,Gumma | 10,000 | |||
| Itakura,Ora,Gumma | 20,000 | 5,000 | ||
| Meiwa,Ora,Gumma | 10,000 | 10,000 | ||
| Chiyoda,Ora,Gumma | 10,000 | 10,000 | ||
| Oizumi,Ora,Gumma | 50,000 | 50,000 | ||
| Ora,Ora,Gumma | 20,000 | 20,000 | 2,000 | |
| Saitama Prefecture | 5,000,000 | 2,000,000 | < 1,000 | |
| Nishi,Saitama,Saitama | 100,000 | 5,000 | ||
| Kita,Saitama,Saitama | 100,000 | 1,000 | ||
| Omiya,Saitama,Saitama | 200,000 | 10,000 | ||
| Minuma,Saitama,Saitama | 100,000 | 20,000 | ||
| Chuo,Saitama,Saitama | 100,000 | 1,000 | ||
| Sakura,Saitama,Saitama | 100,000 | 10,000 | ||
| Urawa,Saitama,Saitama | 100,000 | 2,000 | ||
| Minami,Saitama,Saitama | 100,000 | 20,000 | ||
| Midori,Saitama,Saitama | 100,000 | 10,000 | ||
| Iwatsuki,Saitama,Saitama | 100,000 | 50,000 | ||
| Kawagoe,Saitama | 100,000 | < 1,000 | ||
| Kumagaya,Saitama | 200,000 | 20,000 | ||
| Kawaguchi,Saitama | 500,000 | 200,000 | ||
| Gyoda,Saitama | 100,000 | 50,000 | ||
| Chichibu,Saitama | 50,000 | |||
| Tokorozawa,Saitama | 20,000 | |||
| Hanno,Saitama | < 1,000 | |||
| Kazo,Saitama | 50,000 | 50,000 | ||
| Honjo,Saitama | 50,000 | |||
| Higashimatsuyama,Saitama | 100,000 | 10,000 | ||
| Kasukabe,Saitama | 200,000 | 200,000 | ||
| Sayama,Saitama | 100,000 | |||
| Hanyu,Saitama | 50,000 | 50,000 | ||
| Konosu,Saitama | 100,000 | 50,000 | ||
| Fukaya,Saitama | 100,000 | 10,000 | ||
| Ageo,Saitama | 200,000 | |||
| Soka,Saitama | 200,000 | 200,000 | ||
| Koshigaya,Saitama | 200,000 | 100,000 | ||
| Warabi,Saitama | 50,000 | 50,000 | ||
| Toda,Saitama | 100,000 | 100,000 | ||
| Iruma,Saitama | < 1,000 | |||
| Hatogaya,Saitama | 50,000 | 2,000 | ||
| Asaka,Saitama | 100,000 | 10,000 | ||
| Shiki,Saitama | 50,000 | 10,000 | ||
| Wako,Saitama | 50,000 | 5,000 | ||
| Niiza,Saitama | 100,000 | |||
| Okegawa,Saitama | 50,000 | 2,000 | ||
| Kuki,Saitama | 50,000 | 50,000 | ||
| Kitamoto,Saitama | 50,000 | 1,000 | ||
| Yashio,Saitama | 100,000 | 20,000 | ||
| Fujimi,Saitama | 20,000 | 1,000 | ||
| Misato,Saitama | 100,000 | 50,000 | ||
| Hasuda,Saitama | 50,000 | 1,000 | ||
| Sakado,Saitama | 100,000 | 10,000 | ||
| Satte,Saitama | 50,000 | 20,000 | ||
| Tsurugashima,Saitama | 50,000 | |||
| Hidaka,Saitama | 2,000 | |||
| Yoshikawa,Saitama | 50,000 | 50,000 | ||
| Fujimino,Saitama | 10,000 | |||
| Ina,Kitaadachi,Saitama | 50,000 | |||
| Miyoshi,Iruma,Saitama | 20,000 | |||
| Moroyama,Iruma,Saitama | 20,000 | |||
| Ogose,Iruma,Saitama | < 1,000 | |||
| Namegawa,Hiki,Saitama | 10,000 | < 1,000 | ||
| Ranzan,Hiki,Saitama | 10,000 | |||
| Ogawa,Hiki,Saitama | < 1,000 | |||
| Kawajima,Hiki,Saitama | 20,000 | 5,000 | ||
| Yoshimi,Hiki,Saitama | 20,000 | 10,000 | ||
| Hatoyama,Hiki,Saitama | 1,000 | |||
| Tokigawa,Hiki,Saitama | < 1,000 | |||
| Yokoze,Chichibu,Saitama | 5,000 | |||
| Ogano,Chichibu,Saitama | < 1,000 | |||
| Higashichichibu,Chichibu,Saitama | < 1,000 | |||
| Misato,Kodama,Saitama | 10,000 | |||
| Kamikawa,Kodama,Saitama | 2,000 | |||
| Kamisato,Kodama,Saitama | 10,000 | |||
| Yorii,Osato,Saitama | 10,000 | < 1,000 | ||
| Kisai,Kitasaitama,Saitama | 20,000 | 10,000 | ||
| Kitakawabe,Kitasaitama,Saitama | 10,000 | 5,000 | ||
| Otone,Kitasaitama,Saitama | 10,000 | 10,000 | < 1,000 | |
| Miyashiro,Minamisaitama,Saitama | 20,000 | 20,000 | ||
| Shiraoka,Minamisaitama,Saitama | 20,000 | 10,000 | ||
| Shobu,Minamisaitama,Saitama | 20,000 | 5,000 | ||
| Kurihashi,Kitakatsushika,Saitama | 20,000 | 20,000 | ||
| Washimiya,Kitakatsushika,Saitama | 20,000 | 20,000 | ||
| Sugito,Kitakatsushika,Saitama | 50,000 | 50,000 | ||
| Matsubushi,Kitakatsushika,Saitama | 20,000 | 10,000 | ||
| Chiba Prefecture | 5,000,000 | 2,000,000 | 50,000 | |
| Chuo,Chiba,Chiba | 200,000 | 50,000 | ||
| Hanamigawa,Chiba,Chiba | 100,000 | 100,000 | ||
| Inage,Chiba,Chiba | 100,000 | 20,000 | ||
| Wakaba,Chiba,Chiba | 100,000 | 20,000 | ||
| Midori,Chiba,Chiba | 50,000 | < 1,000 | ||
| Mihama,Chiba,Chiba | 200,000 | 200,000 | ||
| Choshi,Chiba | 50,000 | 5,000 | ||
| Ichikawa,Chiba | 200,000 | 50,000 | ||
| Funabashi,Chiba | 500,000 | 100,000 | 1,000 | |
| Tateyama,Chiba | 20,000 | 1,000 | ||
| Kisarazu,Chiba | 100,000 | < 1,000 | ||
| Matsudo,Chiba | 200,000 | 50,000 | ||
| Noda,Chiba | 100,000 | 100,000 | < 1,000 | |
| Mobara,Chiba | 20,000 | |||
| Narita,Chiba | 100,000 | 100,000 | 10,000 | |
| Sakura,Chiba | 100,000 | 100,000 | 10,000 | |
| Togane,Chiba | 50,000 | 2,000 | ||
| Asahi,Chiba | 50,000 | 10,000 | ||
| Narashino,Chiba | 200,000 | 100,000 | ||
| Kashiwa,Chiba | 200,000 | 20,000 | < 1,000 | |
| Ichihara,Chiba | 200,000 | 10,000 | ||
| Nagareyama,Chiba | 100,000 | 50,000 | ||
| Yachiyo,Chiba | 200,000 | 200,000 | 1,000 | |
| Abiko,Chiba | 100,000 | 50,000 | 10,000 | |
| Kamagaya,Chiba | 100,000 | 20,000 | ||
| Kimitsu,Chiba | 20,000 | |||
| Futtsu,Chiba | 5,000 | |||
| Urayasu,Chiba | 200,000 | 200,000 | ||
| Yotsukaido,Chiba | 50,000 | 20,000 | < 1,000 | |
| Sodegaura,Chiba | 20,000 | |||
| Yachimata,Chiba | 50,000 | 1,000 | ||
| Inzai,Chiba | 50,000 | 50,000 | 10,000 | |
| Shiroi,Chiba | 50,000 | 50,000 | 2,000 | |
| Tomisato,Chiba | 50,000 | 20,000 | 1,000 | |
| Minamiboso,Chiba | 10,000 | 1,000 | ||
| Sosa,Chiba | 50,000 | 10,000 | < 1,000 | |
| Katori,Chiba | 100,000 | 50,000 | 20,000 | |
| Sammu,Chiba | 50,000 | 2,000 | ||
| Isumi,Chiba | 10,000 | |||
| Shisui,Imba,Chiba | 20,000 | 5,000 | ||
| Inba,Inba,Chiba | 10,000 | 10,000 | 2,000 | |
| Motono,Inba,Chiba | 5,000 | 5,000 | 2,000 | |
| Sakae,Imba,Chiba | 20,000 | 20,000 | 2,000 | |
| Kozaki,Katori,Chiba | 5,000 | 5,000 | ||
| Tako,Katori,Chiba | 20,000 | 10,000 | < 1,000 | |
| Tonosho,Katori,Chiba | 10,000 | 2,000 | ||
| Oamishirasato,Sambu,Chiba | 20,000 | < 1,000 | ||
| Kujukuri,Sambu,Chiba | 20,000 | 5,000 | ||
| Shibayama,Sambu,Chiba | 10,000 | 5,000 | ||
| Yokoshibahikari,Sambu,Chiba | 20,000 | 10,000 | ||
| Ichinomiya,Chosei,Chiba | 2,000 | |||
| Mutsuzawa,Chosei,Chiba | 2,000 | |||
| Chosei,Chosei,Chiba | 5,000 | |||
| Shirako,Chosei,Chiba | 10,000 | < 1,000 | ||
| Nagara,Chosei,Chiba | < 1,000 | |||
| Chonan,Chosei,Chiba | < 1,000 | |||
| Kyonan,Awa,Chiba | 5,000 | |||
| Tokyo Prefecture | 10,000,000 | 2,000,000 | 20,000 | |
| Chiyoda,Tokyo | 1,000,000 | 500,000 | 20,000 | |
| Chuo,Tokyo | 500,000 | 20,000 | ||
| Minato,Tokyo | 1,000,000 | 50,000 | ||
| Shinjuku,Tokyo | 1,000,000 | 20,000 | ||
| Bunkyo,Tokyo | 500,000 | 20,000 | ||
| Taito,Tokyo | 200,000 | 100,000 | ||
| Sumida,Tokyo | 200,000 | 5,000 | ||
| Koto,Tokyo | 500,000 | 200,000 | ||
| Shinagawa,Tokyo | 200,000 | |||
| Meguro,Tokyo | 200,000 | |||
| Ota,Tokyo | 500,000 | 5,000 | ||
| Setagaya,Tokyo | 500,000 | 10,000 | ||
| Shibuya,Tokyo | 500,000 | |||
| Nakano,Tokyo | 200,000 | 50,000 | ||
| Suginami,Tokyo | 500,000 | 5,000 | ||
| Toshima-ku,Tokyo | 500,000 | |||
| Kita,Tokyo | 200,000 | 100,000 | ||
| Arakawa,Tokyo | 200,000 | 50,000 | ||
| Itabashi,Tokyo | 500,000 | 100,000 | ||
| Nerima,Tokyo | 500,000 | 1,000 | ||
| Adachi,Tokyo | 500,000 | 200,000 | ||
| Katsushika,Tokyo | 200,000 | < 1,000 | ||
| Edogawa,Tokyo | 500,000 | 100,000 | ||
| Hachioji,Tokyo | 100,000 | |||
| Tachikawa,Tokyo | 20,000 | |||
| Musashino,Tokyo | 200,000 | |||
| Mitaka,Tokyo | 200,000 | 1,000 | ||
| Ome,Tokyo | 20,000 | |||
| Fuchu,Tokyo | 200,000 | |||
| Akishima,Tokyo | < 1,000 | |||
| Chofu,Tokyo | 200,000 | 20,000 | ||
| Machida,Tokyo | 200,000 | |||
| Koganei,Tokyo | 100,000 | |||
| Kodaira,Tokyo | 200,000 | |||
| Hino,Tokyo | 100,000 | 1,000 | ||
| Higashimurayama,Tokyo | 100,000 | |||
| Kokubunji,Tokyo | 50,000 | |||
| Kunitachi,Tokyo | 1,000 | |||
| Komae,Tokyo | 50,000 | 2,000 | ||
| Higashiyamato,Tokyo | 50,000 | |||
| Higashikurume,Tokyo | 10,000 | |||
| Musashimurayama,Tokyo | 20,000 | |||
| Tama,Tokyo | 100,000 | |||
| Inagi,Tokyo | 20,000 | |||
| Nishitokyo,Tokyo | 100,000 | |||
| Niijima,Tokyo | 2,000 | < 1,000 | ||
| Kanagawa Prefecture | 5,000,000 | 1,000,000 | ||
| Tsurumi,Yokohama,Kanagawa | 100,000 | 10,000 | ||
| Kanagawa,Yokohama,Kanagawa | 200,000 | 50,000 | ||
| Nishi,Yokohama,Kanagawa | 200,000 | 100,000 | ||
| Naka,Yokohama,Kanagawa | 200,000 | 200,000 | ||
| Minami,Yokohama,Kanagawa | 100,000 | 100,000 | ||
| Hodogaya,Yokohama,Kanagawa | 100,000 | 2,000 | ||
| Isogo,Yokohama,Kanagawa | 50,000 | 5,000 | ||
| Kanazawa,Yokohama,Kanagawa | < 1,000 | |||
| Kohoku,Yokohama,Kanagawa | 200,000 | 100,000 | ||
| Totsuka,Yokohama,Kanagawa | 100,000 | |||
| Konan,Yokohama,Kanagawa | 100,000 | 10,000 | ||
| Asahi,Yokohama,Kanagawa | 100,000 | 20,000 | ||
| Midori,Yokohama,Kanagawa | 100,000 | 50,000 | ||
| Seya,Yokohama,Kanagawa | 100,000 | |||
| Sakae,Yokohama,Kanagawa | 20,000 | |||
| Izumi,Yokohama,Kanagawa | 100,000 | |||
| Aoba,Yokohama,Kanagawa | 100,000 | 5,000 | ||
| Tsuzuki,Yokohama,Kanagawa | 100,000 | 20,000 | ||
| Kawasaki,Kawasaki,Kanagawa | 200,000 | 100,000 | ||
| Saiwai,Kawasaki,Kanagawa | 100,000 | 50,000 | ||
| Nakahara,Kawasaki,Kanagawa | 200,000 | 20,000 | ||
| Takatsu,Kawasaki,Kanagawa | 100,000 | 10,000 | ||
| Tama,Kawasaki,Kanagawa | 10,000 | |||
| Miyamae,Kawasaki,Kanagawa | 50,000 | 2,000 | ||
| Asao,Kawasaki,Kanagawa | 5,000 | |||
| Yokosuka,Kanagawa | 2,000 | |||
| Hiratsuka,Kanagawa | 200,000 | 50,000 | ||
| Kamakura,Kanagawa | 2,000 | |||
| Fujisawa,Kanagawa | 100,000 | < 1,000 | ||
| Odawara,Kanagawa | 200,000 | 20,000 | ||
| Chigasaki,Kanagawa | 100,000 | < 1,000 | ||
| Sagamihara,Kanagawa | 500,000 | |||
| Hadano,Kanagawa | 1,000 | |||
| Atsugi,Kanagawa | 100,000 | |||
| Yamato,Kanagawa | 200,000 | |||
| Isehara,Kanagawa | 50,000 | |||
| Ebina,Kanagawa | 50,000 | |||
| Zama,Kanagawa | 50,000 | |||
| Minamiashigara,Kanagawa | 10,000 | |||
| Ayase,Kanagawa | 50,000 | |||
| Samukawa,Koza,Kanagawa | 50,000 | 20,000 | ||
| Oiso,Naka,Kanagawa | 5,000 | 2,000 | ||
| Ninomiya,Naka,Kanagawa | 20,000 | 2,000 | ||
| Nakai,Ashigarakami,Kanagawa | 5,000 | |||
| Oi,Ashigarakami,Kanagawa | 20,000 | |||
| Matsuda,Ashigarakami,Kanagawa | 5,000 | |||
| Yamakita,Ashigarakami,Kanagawa | < 1,000 | |||
| Kaisei,Ashigarakami,Kanagawa | 1,000 | |||
| Hakone,Ashigarashimo,Kanagawa | 1,000 | |||
| Aikawa,Aiko,Kanagawa | 10,000 | |||
| Niigata Prefecture | 10,000 | |||
| Nagaoka,Niigata | < 1,000 | |||
| Minamiuonuma,Niigata | 5,000 | |||
| Aga,Higashikambara,Niigata | 1,000 | |||
| Kariwa,Kariwa,Niigata | < 1,000 | |||
| Yamanashi Prefecture | 500,000 | 50,000 | 2,000 | |
| Kofu,Yamanashi | 200,000 | 20,000 | ||
| Fujiyoshida,Yamanashi | 20,000 | |||
| Yamanashi,Yamanashi | 5,000 | |||
| Otsuki,Yamanashi | 2,000 | |||
| Nirasaki,Yamanashi | < 1,000 | |||
| Minamiarupusu,Yamanashi | 20,000 | 2,000 | ||
| Hokuto,Yamanashi | 2,000 | |||
| Kai,Yamanashi | 5,000 | |||
| Fuefuki,Yamanashi | 50,000 | 1,000 | ||
| Koshu,Yamanashi | 20,000 | |||
| Chuo,Yamanashi | 20,000 | 10,000 | ||
| Ichikawamisato,Nishiyatsushiro,Yamanashi | 5,000 | < 1,000 | ||
| Masuho,Minamikoma,Yamanashi | 5,000 | |||
| Kajikazawa,Minamikoma,Yamanashi | 1,000 | < 1,000 | ||
| Minobu,Minamikoma,Yamanashi | < 1,000 | |||
| Showa,Nakakoma,Yamanashi | < 1,000 | < 1,000 | ||
| Nishikatsura,Minamitsuru,Yamanashi | < 1,000 | |||
| Oshino,Minamitsuru,Yamanashi | 10,000 | 10,000 | 1,000 | |
| Yamanakako,Minamitsuru,Yamanashi | 5,000 | 2,000 | < 1,000 | |
| Narusawa,Minamitsuru,Yamanashi | 2,000 | |||
| Fujikawaguchiko,Minamitsuru,Yamanashi | 20,000 | |||
| Nagano Prefecture | 20,000 | < 1,000 | ||
| Suwa,Nagano | 10,000 | |||
| Chino,Nagano | 5,000 | |||
| Saku,Nagano | 2,000 | |||
| Komi,Minamisaku,Nagano | < 1,000 | |||
| Kawakami,Minamisaku,Nagano | < 1,000 | |||
| Minamimaki,Minamisaku,Nagano | 2,000 | < 1,000 | ||
| Minamiaiki,Minamisaku,Nagano | < 1,000 | |||
| Shizuoka Prefecture | 100,000 | |||
| Ito,Shizuoka | < 1,000 | |||
| Gotemba,Shizuoka | 50,000 | |||
| Susono,Shizuoka | < 1,000 | |||
| Izunokuni,Shizuoka | 2,000 | |||
| Oyama,Sunto,Shizuoka | 10,000 |
The summation of the exposed population for each city does not necessarily equal to that of the prefecture or whole of Japan.
Major Historical Damaging Earthquakes in This Region
| Year | Region | M | Damage |
| 1897 | Off Miyagi | 7.7 | 3m tsunami in Sakari; 1.2 m tsunami in Kamaishi. |
| 1898 | Off Miyagi | 7.2 | 1 depot collapsed in Hanamaki. A small tsunami was observed. |
| 1936 | Off Miyagi | 7.4 | Miyagiken-oki Earthquake,3 non-residential houses collapsed. A small tsunami was observed. |
| 1978 | Off Miyagi | 7.4 | Miyagiken-oki Earthquake,28 dead, 1,325 injured, 1,183 houses collapsed, 5,574 partially destroyed, 888 roads damaged, 529 landslides. 18 people were crushed to death by collapsed walls. |
| 2005 | Off Miyagi | 7.2 | 100 injured, 1 house collapsed, 0 partially collapsed. Maximum JMA seismic intensity was 6-. A tsunami was observed along the Pacific coast of Tohoku (with a maximum height of 13 cm). |
| 2011 | Off Sanriku | 9.0 | 2011 off the Pacific coast of Tohoku Earthquake,Mega-thrust earthquake in the subduction zone along the Japan trench from off the middle of Sanriku to off of Ibaraki. 16,278 dead, 2,994 missing, 6,179 injured, 129,198 houses collapsed, 254,238 partially destroyed (as of March 2012; including some damage by aftershocks and induced earthquakes). 90% of fatalities were drownings. Most of the damage was caused by a large tsunami (height of about 40 m, according to field investigation). Maximum Is was 7. The damage by ground motion was relatively less significant. |
| 2011 | Off Miyagi | 7.1 | The intraslab earthquake with the reverse fault of the Pacific plate, induced by the 2011 Off the Pacific Coast of Tohoku Earthquake in its epicentral area. 4 dead, 296 injured, over 36 houses collapsed, over 27 partially collapsed. Maximum Is was 6-upper. |
Reference: National Astronomical Observatory of Japan, "Rika Nenpyo Web Edition", MARUZEN *partially extracted
Seismic Hazard Information of J-SHIS
J-SHIS is a Web service by NIED, to help prevent and prepare for earthquake disaster by providing a public portal for seismic hazard information across Japan.

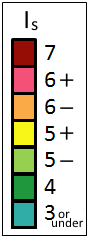

R-20110311144626-0001-00001
J-RISQ (http://www.j-risq.bosai.go.jp/)
(c) 2013 NIED