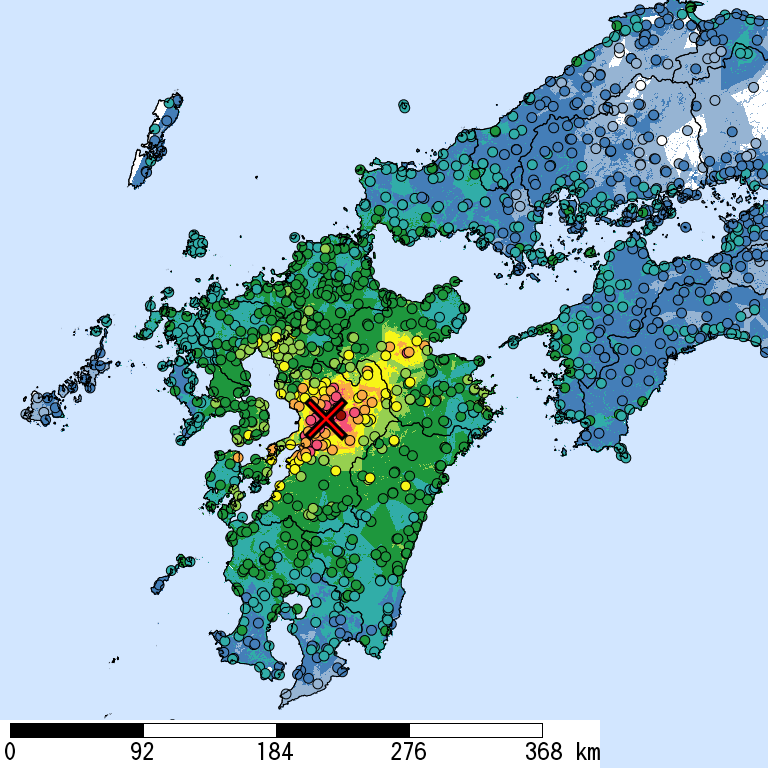
| Max. Obs. Is |
Histogram
of Estimated Is
|
Municipality
Show All Data
|
Nighttime Population |
Distance
[km] |
| 7 |
|
Mashiki,Kamimashiki,Kumamoto |
32,000 |
1 |
| 7 |
|
Nishihara,Aso,Kumamoto |
6,600 |
10 |
| 6+ |
|
Kikuchi,Kumamoto |
50,000 |
19 |
| 6+ |
|
Koshi,Kumamoto |
56,000 |
9 |
| 6+ |
|
Uto,Kumamoto |
38,000 |
18 |
| 6+ |
|
Minamiaso,Aso,Kumamoto |
12,000 |
21 |
| 6+ |
|
Kashima,Kamimashiki,Kumamoto |
10,000 |
7 |
| 6+ |
|
Uki,Kumamoto |
62,000 |
20 |
| 6+ |
|
Ozu,Kikuchi,Kumamoto |
31,000 |
10 |
| 6+ |
|
Higashi,Kumamoto,Kumamoto |
190,000 |
3 |
| 6+ |
|
Yufu,Oita |
34,000 |
72 |
| 6+ |
|
Chuo,Kumamoto,Kumamoto |
180,000 |
8 |
| 6+ |
|
Nishi,Kumamoto,Kumamoto |
92,000 |
14 |
| 6- |
|
Minami,Kumamoto,Kumamoto |
120,000 |
14 |
| 6- |
|
Misato,Shimomashiki,Kumamoto |
12,000 |
17 |
| 6- |
|
Kita,Kumamoto,Kumamoto |
140,000 |
15 |
| 6- |
|
Kikuyo,Kikuchi,Kumamoto |
38,000 |
7 |
| 6- |
|
Aso,Kumamoto |
28,000 |
34 |
| 6- |
|
Tamana,Kumamoto |
69,000 |
26 |
| 6- |
|
Mifune,Kamimashiki,Kumamoto |
17,000 |
9 |
| 6- |
|
Yamato,Kamimashiki,Kumamoto |
17,000 |
21 |
| 6- |
|
Hikawa,Yatsushiro,Kumamoto |
13,000 |
26 |
| 6- |
|
Nagomi,Tamana,Kumamoto |
11,000 |
26 |
| 6- |
|
Kokonoe,Kusu,Oita |
10,000 |
59 |
| 6- |
|
Oguni,Aso,Kumamoto |
7,900 |
43 |
| 6- |
|
Yatsushiro,Kumamoto |
130,000 |
37 |
| 6- |
|
Beppu,Oita |
120,000 |
84 |
| 6- |
|
Amakusa,Kumamoto |
88,000 |
68 |
| 6- |
|
Kamiamakusa,Kumamoto |
29,000 |
41 |
| 5+ |
|
Kanzaki,Saga |
33,000 |
69 |
| 5+ |
|
Gyokuto,Tamana,Kumamoto |
5,400 |
20 |
| 5+ |
|
Minamioguni,Aso,Kumamoto |
4,400 |
41 |
| 5+ |
|
Ubuyama,Aso,Kumamoto |
1,600 |
44 |
| 5+ |
|
Takamori,Aso,Kumamoto |
6,700 |
30 |
| 5+ |
|
Kamimine,Miyaki,Saga |
8,900 |
67 |
| 5+ |
|
Taketa,Oita |
24,000 |
59 |
| 5+ |
|
Kosa,Kamimashiki,Kumamoto |
11,000 |
16 |
| 5+ |
|
Yanagawa,Fukuoka |
71,000 |
54 |
| 5+ |
|
Yamaga,Kumamoto |
55,000 |
26 |
| 5+ |
|
Okawa,Fukuoka |
38,000 |
59 |
| 5+ |
|
Nagasu,Tamana,Kumamoto |
17,000 |
35 |
| 5+ |
|
Kurume,Fukuoka |
300,000 |
63 |
| 5+ |
|
Saga,Saga |
240,000 |
69 |
| 5+ |
|
Hita,Oita |
71,000 |
59 |
| 5+ |
|
Minamishimabara,Nagasaki |
50,000 |
49 |
| 5+ |
|
Miyama,Fukuoka |
41,000 |
49 |
| 5+ |
|
Bungoono,Oita |
40,000 |
75 |
| 5+ |
|
Ashikita,Ashikita,Kumamoto |
19,000 |
62 |
| 5+ |
|
Takachiho,Nishiusuki,Miyazaki |
14,000 |
48 |
| 5+ |
|
Misato,Higashiusuki,Miyazaki |
6,300 |
70 |
| 5+ |
|
Shiiba,Higashiusuki,Miyazaki |
3,100 |
49 |
| 5- |
|
Gokase,Nishiusuki,Miyazaki |
4,500 |
39 |
| 5- |
|
Unzen,Nagasaki |
46,000 |
57 |
| 5- |
|
Chikuzen,Asakura,Fukuoka |
29,000 |
75 |
| 5- |
|
Miyaki,Miyaki,Saga |
26,000 |
66 |
| 5- |
|
Shiroishi,Kishima,Saga |
25,000 |
75 |
| 5- |
|
Tsukumi,Oita |
20,000 |
103 |
| 5- |
|
Oki,Mizuma,Fukuoka |
15,000 |
56 |
| 5- |
|
Yamae,Kuma,Kumamoto |
3,700 |
61 |
| 5- |
|
Saiki,Oita |
77,000 |
104 |
| 5- |
|
Isahaya,Nagasaki |
140,000 |
69 |
| 5- |
|
Arao,Kumamoto |
55,000 |
40 |
| 5- |
|
Chikugo,Fukuoka |
48,000 |
53 |
| 5- |
|
Ogi,Saga |
45,000 |
74 |
| 5- |
|
Tsunagi,Ashikita,Kumamoto |
5,000 |
71 |
| 5- |
|
Nobeoka,Miyazaki |
130,000 |
84 |
| 5- |
|
Yame,Fukuoka |
69,000 |
51 |
| 5- |
|
Shimabara,Nagasaki |
47,000 |
40 |
| 5- |
|
Hitoyoshi,Kumamoto |
35,000 |
65 |
| 5- |
|
Hirokawa,Yame,Fukuoka |
20,000 |
54 |
| 5- |
|
Onga,Onga,Fukuoka |
19,000 |
117 |
| 5- |
|
Kusu,Kusu,Oita |
17,000 |
62 |
| 5- |
|
Nagashima,Izumi,Kagoshima |
11,000 |
88 |
| 5- |
|
Nankan,Tamana,Kumamoto |
11,000 |
37 |
| 5- |
|
Oita,Oita |
470,000 |
89 |
| 5- |
|
Minami,Fukuoka,Fukuoka |
250,000 |
91 |
| 5- |
|
Ogori,Fukuoka |
59,000 |
70 |
| 5- |
|
Usuki,Oita |
41,000 |
100 |
| 5- |
|
Yawatahama,Ehime |
38,000 |
168 |
| 5- |
|
Minamata,Kumamoto |
27,000 |
74 |
| 5- |
|
Asagiri,Kuma,Kumamoto |
17,000 |
62 |
| 4 |
|
Miyazaki,Miyazaki |
400,000 |
115 |
| 4 |
|
Omura,Nagasaki |
90,000 |
79 |
| 4 |
|
Hakata,Fukuoka,Fukuoka |
210,000 |
95 |
| 4 |
|
Iizuka,Fukuoka |
130,000 |
94 |
| 4 |
|
Karatsu,Saga |
130,000 |
105 |
| 4 |
|
Omuta,Fukuoka |
120,000 |
41 |
| 4 |
|
Nogata,Fukuoka |
59,000 |
105 |
| 4 |
|
Asakura,Fukuoka |
56,000 |
70 |
| 4 |
|
Ukiha,Fukuoka |
32,000 |
61 |
| 4 |
|
Satsuma,Satsuma,Kagoshima |
24,000 |
104 |
| 4 |
|
Miyako,Miyako,Fukuoka |
22,000 |
100 |
| 4 |
|
Kawaminami,Koyu,Miyazaki |
17,000 |
95 |
| 4 |
|
Hyuga,Miyazaki |
63,000 |
87 |
| 4 |
|
Morotsuka,Higashiusuki,Miyazaki |
1,800 |
59 |
| 4 |
|
Nakatsu,Oita |
84,000 |
95 |
| 4 |
|
Satsumasendai,Kagoshima |
99,000 |
119 |
| 4 |
|
Tosu,Saga |
70,000 |
69 |
| 4 |
|
Usa,Oita |
59,000 |
96 |
| 4 |
|
Kama,Fukuoka |
42,000 |
85 |
| 4 |
|
Isa,Kagoshima |
29,000 |
84 |
| 4 |
|
Hiji,Hayami,Oita |
28,000 |
93 |
| 4 |
|
Yoshinogari,Kanzaki,Saga |
16,000 |
68 |
| 4 |
|
Tachiarai,Mii,Fukuoka |
15,000 |
65 |
| 4 |
|
Yusui,Aira,Kagoshima |
12,000 |
94 |
| 4 |
|
Ikata,Nishiuwa,Ehime |
11,000 |
163 |
| 4 |
|
Oto,Tagawa,Fukuoka |
5,800 |
90 |
| 4 |
|
Hinokage,Nishiusuki,Miyazaki |
4,600 |
57 |
| 4 |
|
Aka,Tagawa,Fukuoka |
3,200 |
91 |
| 4 |
|
Yukuhashi,Fukuoka |
69,000 |
104 |
| 4 |
|
Ube,Yamaguchi |
170,000 |
134 |
| 4 |
|
Taragi,Kuma,Kumamoto |
11,000 |
60 |
| 4 |
|
Saito,Miyazaki |
33,000 |
95 |
| 4 |
|
Shimonoseki,Yamaguchi |
280,000 |
129 |
| 4 |
|
Kirishima,Kagoshima |
130,000 |
117 |
| 4 |
|
Munakata,Fukuoka |
96,000 |
114 |
| 4 |
|
Kobayashi,Miyazaki |
48,000 |
90 |
| 4 |
|
Kasuya,Kasuya,Fukuoka |
45,000 |
94 |
| 4 |
|
Ureshino,Saga |
29,000 |
78 |
| 4 |
|
Takanabe,Koyu,Miyazaki |
22,000 |
99 |
| 4 |
|
Ebino,Miyazaki |
22,000 |
83 |
| 4 |
|
Itoda,Tagawa,Fukuoka |
9,200 |
94 |
| 4 |
|
Kuma,Kuma,Kumamoto |
4,300 |
62 |
| 4 |
|
Chuo,Fukuoka,Fukuoka |
180,000 |
95 |
| 4 |
|
Nakama,Fukuoka |
45,000 |
113 |
| 4 |
|
Itsuki,Kuma,Kumamoto |
1,200 |
44 |
| 4 |
|
Nishi,Fukuoka,Fukuoka |
190,000 |
97 |
| 4 |
|
Kasuga,Fukuoka |
110,000 |
87 |
| 4 |
|
Onojo,Fukuoka |
92,000 |
87 |
| 4 |
|
Dazaifu,Fukuoka |
74,000 |
83 |
| 4 |
|
Koga,Fukuoka |
56,000 |
107 |
| 4 |
|
Izumi,Kagoshima |
56,000 |
89 |
| 4 |
|
Kanda,Miyako,Fukuoka |
37,000 |
109 |
| 4 |
|
Mizumaki,Onga,Fukuoka |
31,000 |
117 |
| 4 |
|
Kashima,Saga |
31,000 |
73 |
| 4 |
|
Miyawaka,Fukuoka |
30,000 |
103 |
| 4 |
|
Buzen,Fukuoka |
27,000 |
95 |
| 4 |
|
Shingu,Kasuya,Fukuoka |
26,000 |
106 |
| 4 |
|
Taku,Saga |
21,000 |
84 |
| 4 |
|
Tsuno,Koyu,Miyazaki |
11,000 |
93 |
| 4 |
|
Soeda,Tagawa,Fukuoka |
11,000 |
85 |
| 4 |
|
Takaharu,Nishimorokata,Miyazaki |
10,000 |
98 |
| 4 |
|
Kohoku,Kishima,Saga |
9,400 |
76 |
| 4 |
|
Himeshima,Higashikunisaki,Oita |
2,200 |
129 |
| 4 |
|
Miyakonojo,Miyazaki |
170,000 |
122 |
| 4 |
|
Aira,Kagoshima |
75,000 |
120 |
| 4 |
|
Itoshima,Fukuoka |
99,000 |
101 |
| 4 |
|
Wakamatsu,Kitakyushu,Fukuoka |
83,000 |
122 |
| 4 |
|
Takeo,Saga |
51,000 |
84 |
| 4 |
|
Shime,Kasuya,Fukuoka |
42,000 |
92 |
| 4 |
|
Ichikikushikino,Kagoshima |
31,000 |
130 |
| 4 |
|
Matsura,Nagasaki |
25,000 |
118 |
| 4 |
|
Kunitomi,Higashimorokata,Miyazaki |
21,000 |
102 |
| 4 |
|
Kiyama,Miyaki,Saga |
18,000 |
74 |
| 4 |
|
Keisen,Kaho,Fukuoka |
14,000 |
87 |
| 4 |
|
Tara,Fujitsu,Saga |
9,800 |
62 |
| 4 |
|
Reihoku,Amakusa,Kumamoto |
8,100 |
76 |
| 4 |
|
Sagara,Kuma,Kumamoto |
5,000 |
62 |
| 4 |
|
Yunomae,Kuma,Kumamoto |
4,500 |
60 |
| 4 |
|
Akune,Kagoshima |
23,000 |
104 |
| 4 |
|
Nishimera,Koyu,Miyazaki |
1,200 |
71 |
| 4 |
|
Hofu,Yamaguchi |
120,000 |
156 |
| 4 |
|
Kunisaki,Oita |
32,000 |
121 |
| 4 |
|
Kitsuki,Oita |
32,000 |
102 |
| 4 |
|
Sawara,Fukuoka,Fukuoka |
210,000 |
96 |
| 4 |
|
Yamaguchi,Yamaguchi |
200,000 |
165 |
| 4 |
|
Kokurakita,Kitakyushu,Fukuoka |
180,000 |
120 |
| 4 |
|
Yahatahigashi,Kitakyushu,Fukuoka |
71,000 |
118 |
| 4 |
|
Nichinan,Miyazaki |
57,000 |
143 |
| 4 |
|
Seiyo,Ehime |
42,000 |
171 |
| 4 |
|
Umi,Kasuya,Fukuoka |
37,000 |
89 |
| 4 |
|
Sue,Kasuya,Fukuoka |
26,000 |
91 |
| 4 |
|
Fukuchi,Tagawa,Fukuoka |
25,000 |
98 |
| 4 |
|
Bungotakada,Oita |
24,000 |
103 |
| 4 |
|
Nishiki,Kuma,Kumamoto |
11,000 |
66 |
| 4 |
|
Kijo,Koyu,Miyazaki |
5,100 |
94 |
| 4 |
|
Toho,Asakura,Fukuoka |
2,400 |
66 |
| 4 |
|
Mizukami,Kuma,Kumamoto |
2,300 |
57 |
| 4 |
|
Chikushino,Fukuoka |
99,000 |
81 |
| 4 |
|
Kokuraminami,Kitakyushu,Fukuoka |
220,000 |
116 |
| 4 |
|
Nagasaki,Nagasaki |
440,000 |
86 |
| 4 |
|
Sasebo,Nagasaki |
260,000 |
109 |
| 4 |
|
Yahatanishi,Kitakyushu,Fukuoka |
250,000 |
118 |
| 4 |
|
Fukutsu,Fukuoka |
56,000 |
111 |
| 4 |
|
Nakagawa,Chikushi,Fukuoka |
50,000 |
85 |
| 4 |
|
Sasaguri,Kasuya,Fukuoka |
30,000 |
95 |
| 4 |
|
Chikujo,Chikujo,Fukuoka |
20,000 |
98 |
| 4 |
|
Kawasaki,Tagawa,Fukuoka |
18,000 |
88 |
| 4 |
|
Shintomi,Koyu,Miyazaki |
18,000 |
103 |
| 4 |
|
Kawatana,Higashisonogi,Nagasaki |
15,000 |
92 |
| 4 |
|
Kotake,Kurate,Fukuoka |
8,800 |
99 |
| 4 |
|
Koge,Chikujo,Fukuoka |
7,900 |
92 |
| 4 |
|
Shimanto,Kochi |
36,000 |
200 |
| 4 |
|
Kuroshio,Hata,Kochi |
12,000 |
207 |
| 4 |
|
Jonan,Fukuoka,Fukuoka |
130,000 |
95 |
| 4 |
|
Uwajima,Ehime |
83,000 |
170 |
| 4 |
|
Hagi,Yamaguchi |
54,000 |
187 |
| 4 |
|
Sakaiminato,Tottori |
35,000 |
377 |
| 4 |
|
Togitsu,Nishisonogi,Nagasaki |
32,000 |
88 |
| 4 |
|
Ashiya,Onga,Fukuoka |
16,000 |
122 |
| 4 |
|
Hisayama,Kasuya,Fukuoka |
8,500 |
98 |
| 4 |
|
Aya,Higashimorokata,Miyazaki |
7,200 |
98 |
| 4 |
|
Sukumo,Kochi |
23,000 |
180 |
| 4 |
|
Kagoshima,Kagoshima |
600,000 |
135 |
| 4 |
|
Izumo,Shimane |
170,000 |
337 |
| 4 |
|
Moji,Kitakyushu,Fukuoka |
100,000 |
127 |
| 4 |
|
Sanyoonoda,Yamaguchi |
64,000 |
138 |
| 4 |
|
Minamisatsuma,Kagoshima |
39,000 |
160 |
| 4 |
|
Hirado,Nagasaki |
35,000 |
132 |
| 4 |
|
Yanai,Yamaguchi |
35,000 |
177 |
| 4 |
|
Suooshima,Oshima,Yamaguchi |
19,000 |
180 |
| 4 |
|
Kushima,Miyazaki |
20,000 |
153 |
| 4 |
|
Higashisonogi,Higashisonogi,Nagasaki |
8,800 |
86 |
| 4 |
|
Matsuyama,Ehime |
520,000 |
216 |
| 4 |
|
Imabari,Ehime |
170,000 |
247 |
| 4 |
|
Tagawa,Fukuoka |
51,000 |
93 |
| 4 |
|
Masuda,Shimane |
50,000 |
229 |
| 4 |
|
Oda,Shimane |
38,000 |
308 |
| 4 |
|
Etajima,Hiroshima |
26,000 |
219 |
| 4 |
|
Kadogawa,Higashiusuki,Miyazaki |
19,000 |
87 |
| 4 |
|
Kurate,Kurate,Fukuoka |
18,000 |
110 |
| 3 |
|
Mine,Yamaguchi |
29,000 |
156 |
| 3 |
|
Tokushima,Tokushima |
270,000 |
375 |
| 3 |
|
Kure,Hiroshima |
240,000 |
229 |
| 3 |
|
Fuchu,Aki,Hiroshima |
49,000 |
237 |
| 3 |
|
Ozu,Ehime |
47,000 |
180 |
| 3 |
|
Iki,Nagasaki |
29,000 |
147 |
| 3 |
|
Mimata,Kitamorokata,Miyazaki |
26,000 |
122 |
| 3 |
|
Yoshitomi,Chikujo,Fukuoka |
6,800 |
95 |
| 3 |
|
Imari,Saga |
57,000 |
100 |
| 3 |
|
Iyo,Ehime |
38,000 |
206 |
| 3 |
|
Kochi,Kochi |
340,000 |
267 |
| 3 |
|
Higashi,Fukuoka,Fukuoka |
290,000 |
97 |
| 3 |
|
Saijo,Ehime |
110,000 |
253 |
| 3 |
|
So,Kagoshima |
39,000 |
129 |
| 3 |
|
Masaki,Iyo,Ehime |
31,000 |
208 |
| 3 |
|
Aki,Kochi |
19,000 |
299 |
| 3 |
|
Kimotsuki,Kimotsuki,Kagoshima |
17,000 |
162 |
| 3 |
|
Kawara,Tagawa,Fukuoka |
12,000 |
96 |
| 3 |
|
Hioki,Kagoshima |
51,000 |
134 |
| 3 |
|
Tottori,Tottori |
200,000 |
435 |
| 3 |
|
Minami,Hiroshima,Hiroshima |
140,000 |
234 |
| 3 |
|
Mitoyo,Kagawa |
69,000 |
310 |
| 3 |
|
Kanonji,Kagawa |
62,000 |
303 |
| 3 |
|
Tobata,Kitakyushu,Fukuoka |
62,000 |
121 |
| 3 |
|
Nagato,Yamaguchi |
38,000 |
178 |
| 3 |
|
Saikai,Nagasaki |
31,000 |
109 |
| 3 |
|
Arita,Nishimatsura,Saga |
21,000 |
99 |
| 3 |
|
Saza,Kitamatsura,Nagasaki |
14,000 |
117 |
| 3 |
|
Osakikamijima,Toyota,Hiroshima |
8,300 |
255 |
| 3 |
|
Omachi,Kishima,Saga |
7,200 |
78 |
| 3 |
|
Osaki,So,Kagoshima |
14,000 |
153 |
| 3 |
|
Minami,Okayama,Okayama |
170,000 |
343 |
| 3 |
|
Iwakuni,Yamaguchi |
140,000 |
201 |
| 3 |
|
Hamada,Shimane |
62,000 |
261 |
| 3 |
|
Maniwa,Okayama |
49,000 |
368 |
| 3 |
|
Toon,Ehime |
35,000 |
221 |
| 3 |
|
Aizumi,Itano,Tokushima |
32,000 |
373 |
| 3 |
|
Ishii,Myozai,Tokushima |
26,000 |
366 |
| 3 |
|
Hirao,Kumage,Yamaguchi |
13,000 |
173 |
| 3 |
|
Kamijima,Ochi,Ehime |
7,500 |
275 |
| 3 |
|
Hidaka,Takaoka,Kochi |
5,600 |
253 |
| 3 |
|
Abu,Abu,Yamaguchi |
3,700 |
199 |
| 3 |
|
Hatsukaichi,Hiroshima |
110,000 |
223 |
| 3 |
|
Minamiawaji,Hyogo |
50,000 |
404 |
| 3 |
|
Awa,Tokushima |
40,000 |
349 |
| 3 |
|
Okagaki,Onga,Fukuoka |
32,000 |
118 |
| 3 |
|
Ainan,Minamiuwa,Ehime |
24,000 |
167 |
| 3 |
|
Kitajima,Itano,Tokushima |
21,000 |
377 |
| 3 |
|
Takehara,Hiroshima |
28,000 |
259 |
| 3 |
|
Naka,Hiroshima,Hiroshima |
130,000 |
233 |
| 3 |
|
Shunan,Yamaguchi |
150,000 |
167 |
| 3 |
|
Onomichi,Hiroshima |
140,000 |
285 |
| 3 |
|
Yoshinogawa,Tokushima |
44,000 |
358 |
| 3 |
|
Komatsushima,Tokushima |
42,000 |
376 |
| 3 |
|
Otake,Hiroshima |
28,000 |
207 |
| 3 |
|
Manno,Nakatado,Kagawa |
19,000 |
321 |
| 3 |
|
Uchiko,Kita,Ehime |
18,000 |
191 |
| 3 |
|
Yurihama,Tohaku,Tottori |
17,000 |
411 |
| 3 |
|
Tosashimizu,Kochi |
16,000 |
201 |
| 3 |
|
Shodoshima,Shozu,Kagawa |
16,000 |
368 |
| 3 |
|
Matsushige,Itano,Tokushima |
14,000 |
380 |
| 3 |
|
Higashikushira,Kimotsuki,Kagoshima |
6,900 |
158 |
| 3 |
|
Yoshika,Kanoashi,Shimane |
6,800 |
202 |
| 3 |
|
Asaminami,Hiroshima,Hiroshima |
230,000 |
240 |
| 3 |
|
Higashihiroshima,Hiroshima |
190,000 |
255 |
| 3 |
|
Nishiyodogawa,Osaka,Osaka |
97,000 |
479 |
| 3 |
|
Toyoka,Hyogo |
86,000 |
479 |
| 3 |
|
Tamano,Okayama |
64,000 |
346 |
| 3 |
|
Sakaide,Kagawa |
55,000 |
329 |
| 3 |
|
Nankoku,Kochi |
50,000 |
278 |
| 3 |
|
Nagayo,Nishisonogi,Nagasaki |
45,000 |
86 |
| 3 |
|
Saka,Aki,Hiroshima |
14,000 |
233 |
| 3 |
|
Kumakogen,Kamiukena,Ehime |
9,600 |
217 |
| 3 |
|
Tsuwano,Kanoashi,Shimane |
8,400 |
216 |
| 3 |
|
Genkai,Higashimatsura,Saga |
6,400 |
114 |
| 3 |
|
Matsuno,Kitauwa,Ehime |
4,400 |
184 |
| 3 |
|
Tano,Aki,Kochi |
2,800 |
306 |
| 3 |
|
Matsue,Shimane |
210,000 |
361 |
| 3 |
|
Daito,Osaka |
130,000 |
493 |
| 3 |
|
Mihara,Hiroshima |
100,000 |
275 |
| 3 |
|
Kudamatsu,Yamaguchi |
56,000 |
167 |
| 3 |
|
Awaji,Hyogo |
46,000 |
422 |
| 3 |
|
Tsushima,Nagasaki |
34,000 |
209 |
| 3 |
|
Konan,Kochi |
34,000 |
282 |
| 3 |
|
Kaita,Aki,Hiroshima |
28,000 |
237 |
| 3 |
|
Makurazaki,Kagoshima |
23,000 |
176 |
| 3 |
|
Itano,Itano,Tokushima |
15,000 |
371 |
| 3 |
|
Tajiri,Sennan,Osaka |
9,800 |
452 |
| 3 |
|
Akiota,Yamagata,Hiroshima |
7,300 |
237 |
| 3 |
|
Ochi,Takaoka,Kochi |
6,300 |
242 |
| 3 |
|
Geisei,Aki,Kochi |
4,000 |
291 |
| 3 |
|
Ojika,Kitamatsura,Nagasaki |
2,700 |
168 |
| 3 |
|
Tosa,Kochi |
29,000 |
256 |
| 3 |
|
Tarumizu,Kagoshima |
16,000 |
145 |
| 3 |
|
Yusuhara,Takaoka,Kochi |
4,000 |
208 |
| 3 |
|
Tobe,Iyo,Ehime |
21,000 |
213 |
| 3 |
|
Kurashiki,Okayama |
470,000 |
339 |
| 3 |
|
Kita,Sakai,Osaka |
150,000 |
478 |
| 3 |
|
Matsubara,Osaka |
130,000 |
481 |
| 3 |
|
Kanoya,Kagoshima |
100,000 |
158 |
| 3 |
|
Minato,Osaka,Osaka |
82,000 |
478 |
| 3 |
|
Ibusuki,Kagoshima |
44,000 |
172 |
| 3 |
|
Higashikagawa,Kagawa |
34,000 |
366 |
| 3 |
|
Kami,Kochi |
29,000 |
283 |
| 3 |
|
Tadotsu,Nakatado,Kagawa |
23,000 |
318 |
| 3 |
|
Kotora,Tohaku,Tottori |
18,000 |
400 |
| 3 |
|
Daisen,Saihaku,Tottori |
17,000 |
390 |
| 3 |
|
Hasami,Higashisonogi,Nagasaki |
15,000 |
92 |
| 3 |
|
Kamiita,Itano,Tokushima |
13,000 |
365 |
| 3 |
|
Kihoku,Kitauwa,Ehime |
12,000 |
182 |
| 3 |
|
Tsuno,Takaoka,Kochi |
6,400 |
234 |
| 3 |
|
Nahari,Aki,Kochi |
3,500 |
307 |
| 3 |
|
Ino,Agawa,Kochi |
25,000 |
258 |
| 3 |
|
Minamikyushu,Kagoshima |
39,000 |
161 |
| 3 |
|
Shimanto,Takaoka,Kochi |
19,000 |
222 |
| 3 |
|
Kaminoseki,Kumage,Yamaguchi |
3,200 |
167 |
| 3 |
|
Amagasaki,Hyogo |
460,000 |
476 |
| 3 |
|
Takamatsu,Kagawa |
420,000 |
346 |
| 3 |
|
Toyonaka,Osaka |
390,000 |
484 |
| 3 |
|
Sumiyoshi,Osaka,Osaka |
150,000 |
478 |
| 3 |
|
Asakita,Hiroshima,Hiroshima |
150,000 |
247 |
| 3 |
|
Yonago,Tottori |
150,000 |
373 |
| 3 |
|
Saeki,Hiroshima,Hiroshima |
130,000 |
226 |
| 3 |
|
Ikuno,Osaka,Osaka |
130,000 |
483 |
| 3 |
|
Shikokuchuo,Ehime |
90,000 |
287 |
| 3 |
|
Anan,Tokushima |
75,000 |
379 |
| 3 |
|
Taisho,Osaka,Osaka |
68,000 |
478 |
| 3 |
|
Fukushima,Osaka,Osaka |
65,000 |
480 |
| 3 |
|
Hokuei,Tohaku,Tottori |
15,000 |
404 |
| 3 |
|
Satosho,Asakuchi,Okayama |
11,000 |
318 |
| 3 |
|
Kotohira,Nakatado,Kagawa |
9,900 |
320 |
| 3 |
|
Tobishima,Ama,Aichi |
4,400 |
607 |
| 3 |
|
Tosa,Tosa,Kochi |
4,300 |
274 |